


36# Bollinger Bands with Nonlinear MA
Janus Trader 2025
This strategy combines Bollinger Bands, a Nonlinear Moving Average (NMA), and a
Hull Moving Average (HMA) with Kalman smoothing to identify market structure, volatility, and trend direction.
It is designed for traders who prefer trend-following setups with volatility confirmation and clear entry/exit signals.
Setup
-
Chart Type: Candlestick (any asset, works best on Forex, Indices, and Crypto).
-
Timeframe: 15-minute and above.
-
Indicators Used:
-
Nonlinear Moving Average (NMA): Black stepline to filter overall trend.
-
VWAP (Volume Weighted Average Price): Purple line as a fair value benchmark.
-
Bollinger Bands (20, 2): Red baseline with blue upper/lower bands for volatility expansion.
-
Hull MA + Kalman Filter: Green/Red channel to generate Buy/Sell signals.
-

Trading Rules
Buy Setup
Buy label appears below the bar.
-
Price is above NMA and preferably above VWAP.
Hull MA turns green (short line > long line).
Entry on the next candle open.

Sell Setup
-
Sell label appears above the bar.
Price is below NMA and preferably below VWAP.
Hull MA turns red (long line > short line).
Entry on the next candle open.
Note Important : Maximum two tolerance candles to check the alignment of the conditions, but 1 candle 2 is recommended only with price levels not far from the close of the candle with the buy or sell signal.

Exit Rules
-
Take Profit: At opposite Bollinger Band or fixed R:R ratio (e.g., 1:2).
Stop Loss: Below (for Buy) / above (for Sell) the most recent swing or opposite side of the Bollinger Band.
Optional Exit: When Hull MA flips color in the opposite direction.
Conclusion
This strategy works best in trending environments with volatility
expansion.
It avoids overtrading by waiting for confirmed Hull MA crossovers supported by NMA trend and
Bollinger/VWAP confluence.
As always, traders should backtest, manage risk, and adapt parameters to their specific market and timeframe.


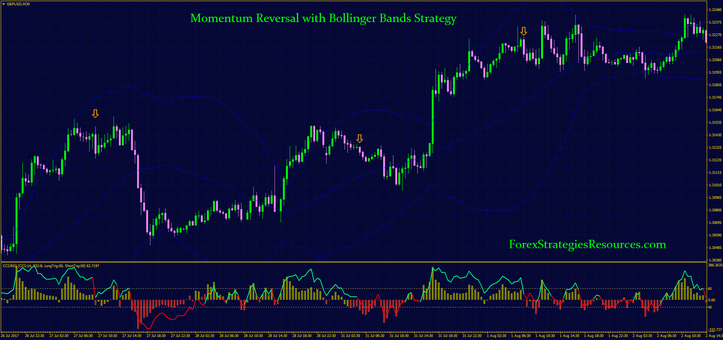
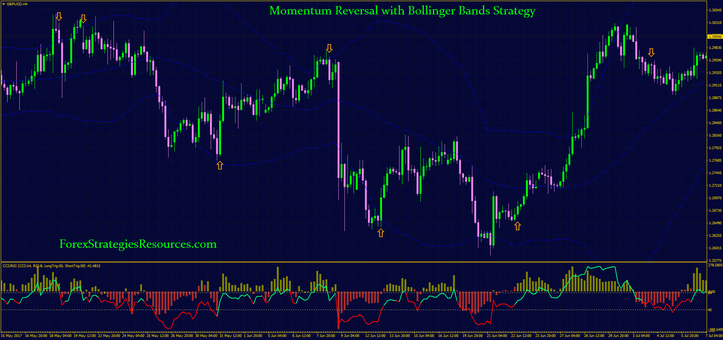
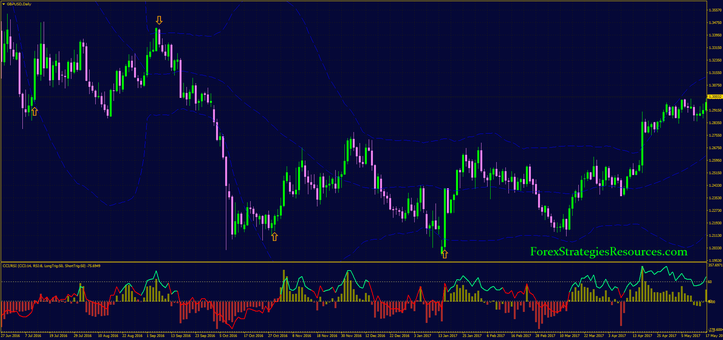
36# Momentum Reversal with Bollinger Bands Strategy
Bollinger Bands Reversal strategy
CCI and RSI for reversal trading
Submit by Dimitry 2017
Momentum Reversal with Bollinger Bands Strategy is a classic strategy with MT4 momentum indicators. The purpose of this trading system is find the condition for reversal trading when the price is out the Bollinger Bands.
Time frame 5 min or higher.
Currency pairs: EUR/USD, EUR/CHF, EUR/GBP, USD/CHF, AUD/USD, USD/CAD, GBP/JPY, GBP/USD, NZD/USD, USD/JPY.
Metatrader Indicators:
Bollinger Bands (period 50, deviations 2.0),
CCI RSI indicator (CCI 14, RSI 8, RSI long 50 + RSI short 50 -),
RSI color (10 period).
Trading Rules Momentum Reversal with Bollinger Bands Strategy
Buy
Price out the low Bollinger Bands.
When the price come back in the Bollinger Bands waith the trigger long of the CCI-RSI and RSI.
Place initial stop loss on the previous swing low.
Make profit with predetermined profit target that depends by pairs, or at the middle band of BB.
Sell
Price out the upper Bollinger Bands.
When the price come back in the Bollinger Bands waith the trigger short of the CCI-RSI and RSI.
Place initial stop loss on the previous swing high.
Make profit with predetermined profit target that depends by pairs, or at the middle band of BB.
Disadvantages: in the strong trend this trading system can generate false signals.
Advantages: in range market and medium trend works good.
In the pictures Momentum Reversal with Bollinger Bands Strategy in action.
Share your opinion, can help everyone to understand the forex strategy.
-
#1
Simple and good strategy..Thanks for share..
