

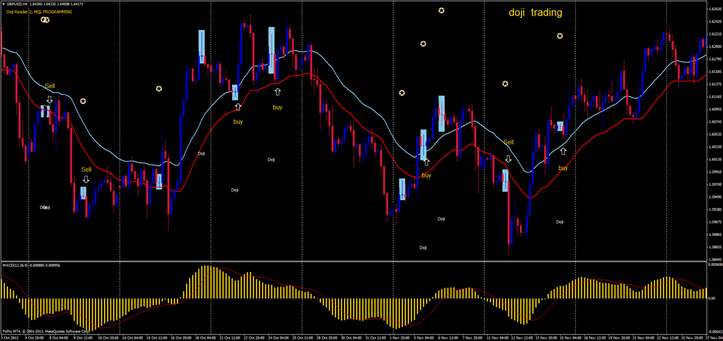
18# Low close doji and High close doji
Candlestick patterns LCD and HCD
Submit by Ferrer 04/01/2014
Low close doji and High close doji are two candlestick patterns.
Trading with doji
Time Frame 4H or daily,
Markets: any.
Indicators:
doji,
Macd (12,26,9);
25 EMA Channel (25 Ema High and 25 EMA low).
Low close doji (LCD)
It is a setup developed on the premise that once the market has rallied and established a high, when a doji forms, it is indicating there is indecision; and once we es- tablish a lower closing low below the doji’s low, as shown in Figure which establishes that there is a loss in bullish momentum, we can initiate a short position.
When the market is in an extended trend to the upside and the market is overbought, a doji appears, indicating indecision and weakness of buyers to maintain the upward trend. Pay particular attention if the candle preceding the doji is a tall white candle, which would be a two-candle pattern called a bearish harami doji cross. Watch for increased volume, as this also con- firms a blow-off-top formation.
Trading Rules When a doji appears, you should:
• Sell on the close or the next time period’s open once a new closing low is made from the previous time period’s doji’s low, especially when the market is against a key pivot point resistance target number. • Place stops above the highest high point of the initial doji candle. Stops should be initially placed as a stop-close-only, meaning you do not exit the trade unless the market closes back above the doji’s high. • Exit on the open of the first candle after the previous candle makes a higher closing high than the previous candle.
You can use a filter confirming the signal, such as a MACD pattern
You initially placed a stop-close-only; but for an intraday time period, this would have been a mental stop-close-only because most order platforms do not have that feature for day trading. As the market has moved in your favor, you can place a hard stop above the doji high. There will be times when you have to make a judgment on whether the risk is too excessive by the distance of the proposed entry and the stop-close-only. Therefore, you may want to scale out of two-thirds of a position at the first sign you see the trend lose momentum
High close doji (HCD)
We are looking for a specific conditional change to take place in the market, namely a higher closing high above a doji’s high at the pivot point support level. This is the pattern I call the high close doji (HCD)
method. It has dimensions of specific criteria that need to fall in place, helping to eliminate and to filter out false signals. It is a simple and basic approach to candlestick chart patterns that is a high-probability winning strategy.
When the market is in an extended trend to the downside and the market condition is oversold, a doji appears, indicating indecision and weakness of sellers to maintain the downward trend. In addition, prices are near a pro- jected pivot point support target level. When a doji appears, you should:
• Buy on the close or on the next open after a new closing high is made from the previous doji candle high, especially when the market is against a key pivot point support target number. • Place stops below the lowest low point of the doji. Stops should be ini- tially placed as a stop-close-only, meaning you do not exit the trade un- less the market closes back below the doji’s low. • Sell or exit the trade on the close or on the next open of a candle that makes a lower closing low near a key pivot point resistance number.
You can use a “filter” or backup process to confirm the buy signal, such as a MACD indicator or channel of moving averages.

Write a comment
K thangaraju (Wednesday, 21 February 2024 10:23)
doji weekly