

678# Trend Detection
Submit by Dimitry 19/03/2016
This will help to trend indicators CCI and StLregr: if the first is above zero, it means that the trend is up, and vice versa. The slope of the lines of the second display (and better determine the trend in the timeframe of not less than D1 for both indicators) will also indicate the direction of the current trend in the market - an increase or a decrease. Complementing are indications RSI indicator: Green - growth, Red - decrease.
Some momentum with the trend
It is important to find an entry point into the market with the least risk; for this it is necessary to know when to begin the momentum, and when - just rollback as a pullback risk of incorrect input is higher than the trend ( "trend is your friend", do not forget it). To determine the pulse watch the indicator FTLM-STLM: if the fastest time of the same direction as the slow - it is said that there is a pulse; if a quick point is directed against the slow - is rolled back. Risky input - after the formation of peaks or troughs slow moment, least risky entry - after passing a zero value to them, when he saw the first pullback and fast time turned toward the slow moment - a moment volnovikov will be the third wave, where they go more often. Confirmation of the presence of the pulse is stochastic, MACD-FID - Sttrigg indicator, it must be developed in accordance with the moments of the previous indicator, the least risky input here will be the moment when the reversal occurs in the "critical" zone over | 300 |, because the light in her long delayed and is most strongly. Reduce the level of risk is possible, waiting for crossing the zero level. It is important, looking at the regression channel indicator, noted in a zone in relation to the average of the red line is the price at the moment: if the price went to the second or third boundary of the channel - so we should expect a return to a similar opposite line of the middle, as it It plays the role of a sort of "balance line".
reversals
The direction of the indicator lines FTLM-STLM, if the direction of the slow and fast the time is not the same - it is rolled back. On rollback is said and price position relative to the boundaries of the channel - with an upward trend dvvizhenie prices to the lower limit - sliding motion. Confirmation - corresponding movement stochastics.
anticipated target
On the timeframe H4 watch target display setting SDLnew: Blue dotted lines - the lower target, the red dotted lines - the top target for medium-term and intraday trading. You can work on daily, weekly schedule with relevant tselyami.DOPOLNITELNYE INDICATORS
Indicators MA7 and MA15 - as trending, give an indication of the presence or absence of the trend at the senior timeframe. Alligator - a steady trend when all the lines are on the same side of the price. The absence of a trend - the periodic indicator intersection lines with lateral movement of the price.
END OF TREND
First of all, about the end of the trend signals trend indicators - CCI100 its divergence (divergence with the price movement direction), persechenii critical areas 100 and -100, as well as the zero line. The same can be said about the stochastics. Convergence dotted lines alligator - also signal the end of the trend.
LED pivot
RD Pivot Lines - mostly intradeyny indicator for him working timeframe - no higher than H1 .. essence - if opened above the pivot day price, then the price will be higher mainly, will try to break through the resistance at the top, stopping at each of them, or coming back later. If the opening below the pivot - on the contrary. Fans of indicator Camarilla it will also be useful - it is possible to include it in the settings (indicated by the intraday channels).
PS The proposed dimension of the CCI indicator is equal to 100, more acceptable than the classical value of 14.
ОПРЕДЕЛЕНИЕ ТРЕНДА
В этом помогут трендовые индикаторы CCI и StLregr: если первый выше нуля, значит, тренд восходящий, и наоборот. Наклон линий второго индикатора (а определять тренд лучше на таймфрейме не ниже D1 для обоих индикаторов) также укажет направление действующей на рынке тенденции - рост или снижение. Дополнением служат показания индикатора RSI: зеленый цвет - рост, красный - снижение.
ОПРЕДЕЛЕНИЕ ИМПУЛЬСА ПО ТРЕНДУ
Важно найти момент входа в рынок с наименьшими рисками; для этого необходимо знать, когда начинается импульс, а когда - всего лишь откат, поскольку на откате риск неверного входа выше, чем по тренду ("тренд-твой друг", не стоит этого забывать). Для определения импульса смотрим за индикатором FTLM-STLM: если быстрый момент совпадает по направлению с медленным - это говорит о наличии именно импульса; если же быстрый момент направлен против медленного - это откат. Рискованный вход - после формирования вершины или впадины медленным моментом, наименее рискованный вход - после прохождения им нулевого значения, когда УЖЕ произошел первый откат и быстрый момент развернулся в сторону медленного момента - это у волновиков будет третьей волной, на которой они и выезжают чаще всего. Подтверждением наличия импульса служит стохастик-МАКД-ССИ - индикатор Sttrigg: он должен развернуться также в соответствии с моментами предыдущего индикатора, наименее рискованным входом здесь будет момент, когда разворот происходит в "критической" зоне больше |300|, поскольку в ней индикатор долго не задерживается и выходит наиболее сильно. Уменьшить степень риска можно, дождавшись перехода через нулевой уровень. Немаловажно, глядя на индикатор канала регрессии, отметить, в какой зоне по отношению к средней красной линии находится цена в настоящий момент: если цена ушла к второй или третьей границе канала - значит, следует ожидать возврата к аналогичной противоположной линии за средней, так как она играет своего рода роль "линии баланса".
ОПРЕДЕЛЕНИЕ ОТКАТА
Следим за направлением линий индикатора FTLM-STLM, если направление медленного и быстрого момента не совпадает - это откат. Об откате же говорит и положение цены относительно границ канала - при восходящей тенденции дввижение цены к нижним границам - откатное движение. Подтверждение - соответствующее движение стохастика.
ПРЕДПОЛАГАЕМЫЕ ЦЕЛИ
На таймфрейме Н4 смотрим целевые установки индикатора SDLnew: голубые пунктиры - цели нижние, красные пунктиры - цели верхние для среднесрочной и интрадей-торговли. Можно работать и по дневному, недельному графику с соответствующими целями.ДОПОЛНИТЕЛЬНЫЕ ИНДИКАТОРЫ
Индикаторы МА7 и МА15 - также трендовые, дают представление о наличии или отсутствии тренда на старшем таймфрейме. Аллигатор - установившийся тренд, когда все линии находятся по одну сторону цены. Отсутствие тренда - периодическое пересечение линий индикатора при боковом движении цены.
ОКОНЧАНИЕ ТРЕНДА
Прежде всего об окончании тренда сигнализируют трендовые индикаторы - CCI100 своей дивергенцией (расхождение направления движения с ценой), персечением критических зон +100 и -100, а также нулевой линии. То же самое можно сказать и о стохастике. Схождение пунктирных линий аллигатора - также сигнал об окончании тренда.
ИНДИКАТОР ПИВОТ
RD Pivot Lines - преимущественно интрадейный индикатор, для него рабочий таймфрейм - не выше Н1.. Суть - если выше пивота открыт день ценой, значит, преимущественно цена будет выше, будет пытаться пробить сопротивления вверху, останавливаясь на каждом из них или возвращаясь ниже. Если открытие ниже пивота - наоборот. Любителям индикатора Камарилла он также будет полезен - есть возможность включить его в настройках (указывает горизонтальные интрадей каналы).
PS Предложенная размерность индикатора CCI равная 100, более приемлемая, нежели классическое значение в 14
In the pictures Trend Detection.
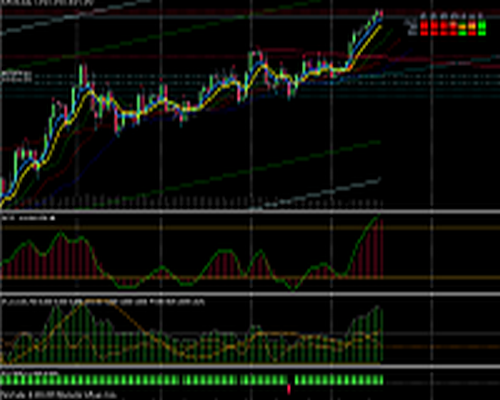
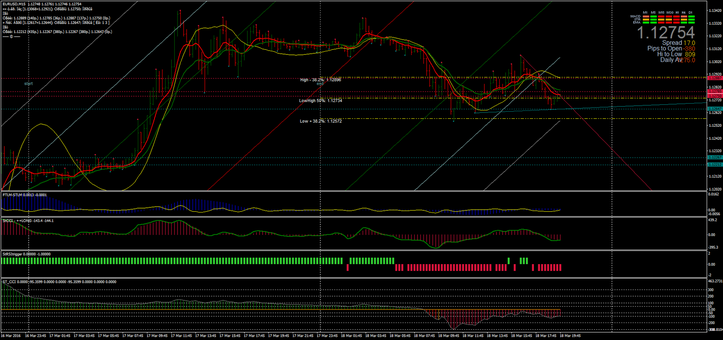
Share your opinion, can help everyone to understand the forex strategy
|
|
|
|
|
|
|
|
|
|
|
|
|
|
|
|
|
|
|
|
|
|
|
|
|
|
|
|
|
|
|
|
