692# Gann with NPFX
Gann Hilo filtered
Submit by Romaks 20/07/2016
Gann with NPFX trend-momentum system.
Time frame h1 or higher.
Financial market any.
This is the most important part of using my trading system. All the criteria have to be exactly matched for successful order placements.
Metatrader Indicators:
Gann hilo,
NPFX hilo,
RSI alert.
We are going to look at two charts for trend determination- Weekly and Daily (W1
and D1). Only a handful of pairs will be trending enough to give you high probability
entries, so it's worth going through all the pairs in market watch starting by checking
the Weekly charts. For more info read section "Let's Get Efficient!".
Long/Buy signal
1. Open a weekly chart and make sure that the last 3, 4, 5 candles are all moving
in the same direction, each one making new highs. (The more candles moving
in se same direction the better, but you can start from 3).
2. When you find a Weekly Chart (W1) that is trending go down to the Daily
Chart (D1) and make sure it "looks" right - most of the time it will be trending
just like W1.
On the Daily Chart you want to make sure that the last 15 - 25 trading days are
moving in one direction. Drawing trend lines can be very useful. If you need
more information about drawing trend-lines find a book called Stikky Stock
Charts - it is the best of the best on the subject!
3. If the daily chart is trending then you can go to 4hr Chart (H4) - this is where
you will hunt for a trade. The price has to be moving in the same direction as
in the Weekly and Daily Charts.
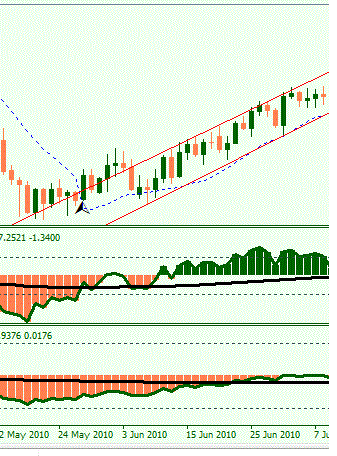
Now you have to wait for both of the bottom indicator green lines to move
above the middle black line and there has to be an arrow pointing upwards
on the candle. Wait until the candle with an arrow pointing upwards closes
and then enter the trade with a buy position. Please note that the time
indicator counts down the time left for the candle to close.
Short/Sell signal
1. Open a weekly chart and make sure that the last 3, 4, 5 candles are all moving
in the same direction, each one making new lows.
2. When you find a Weekly Chart (W1) that is trending go down to the Daily
Chart (D1) and make sure it "looks" right - most of the time it will be trending
just like W1.
On the Daily Chart you want to make sure that the last 15 - 25 trading days are
moving in one direction.
3. If the daily chart is trending then you can go to 4hr Chart (H4) - this is where
you will hunt for a trade. The price has to be moving in the same direction as
in the Weekly and Daily Charts.
Now you have to wait for both of the bottom indicator green lines to move
below the middle black line and there has to be an arrow pointing
downwards on the candle. Wait until the candle with an arrow pointing
downwards closes and then enter the trade with a sell position. Please note
that the time indicator counts down the time left for the candle to close.
Exit
When you open the trade simply put 50 pips Stop Loss and 60 pips Take Profit and
leave the trade until one of these levels are reached. This strategy is basic but good
as the trades are expected to move at least 60 pips and this method gives the trader
higher than 1:1 Risk/ Reward ratio.


asaens (Friday, 22 July 2016 20:56)
I meant "Donchian trading" if typed something different
asaens (Friday, 22 July 2016 20:53)
for admin: Donchian channel post after this is misdirected
toby (Wednesday, 20 July 2016 20:49)
Any indicator repaint???