


42# Vwap Trading Method MT4, MT5, TradingView
Janus Trader 2025
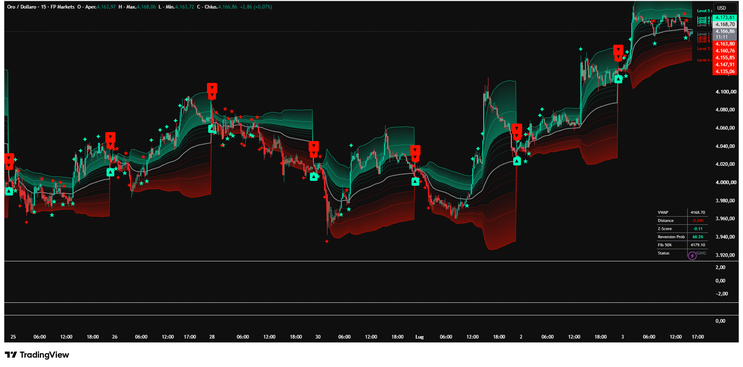
Update 2026 : Quant Flow: Precision Fibonacci Vwap -Emiliano (see in the middle page)
The Volume Weighted Average Price (VWAP) is more than just a technical indicator — it's a cornerstone of institutional trading, providing a reliable benchmark for price relative to volume. By combining price action with volume flow, VWAP offers valuable insight into market sentiment and fair value. In this article, we explore two robust trading strategies that leverage VWAP and its standard deviation bands: VWAP Trend Rider and VWAP Snapback. Designed for MT4, MT5, and TradingView platforms, these strategies are tailored to help traders navigate both trending and mean-reverting market conditions with precision. Whether you're aiming to ride strong momentum or capitalize on price overextensions, this guide offers clear, rule-based approaches to enhance your intraday trading edge.
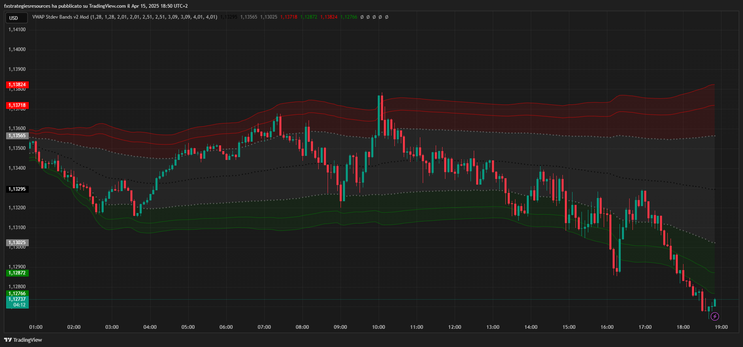
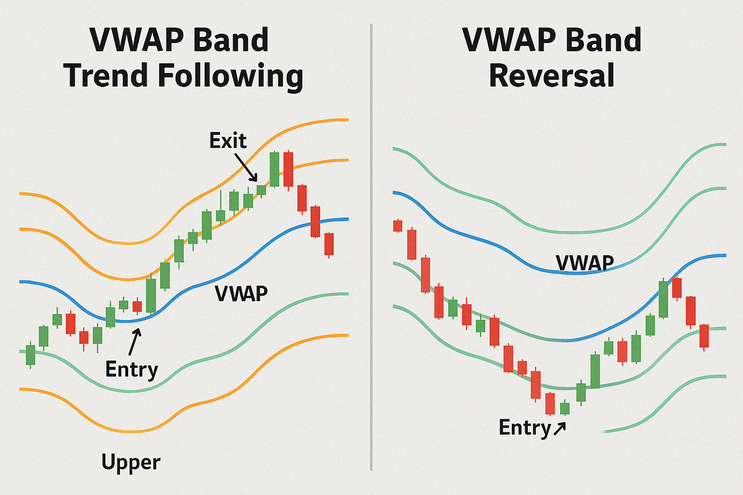
Strategy 1: VWAP Band Trend Following
Name: VWAP Trend Rider
Type: Trend-Following
Recommended Timeframes: 5-minute (5m) and 15-minute (15m)
Indicators Used
-
VWAP (Volume Weighted Average Price)
-
VWAP Bands (±1 standard deviation and ±2 standard deviations)
Long Setup (Bullish Trend)
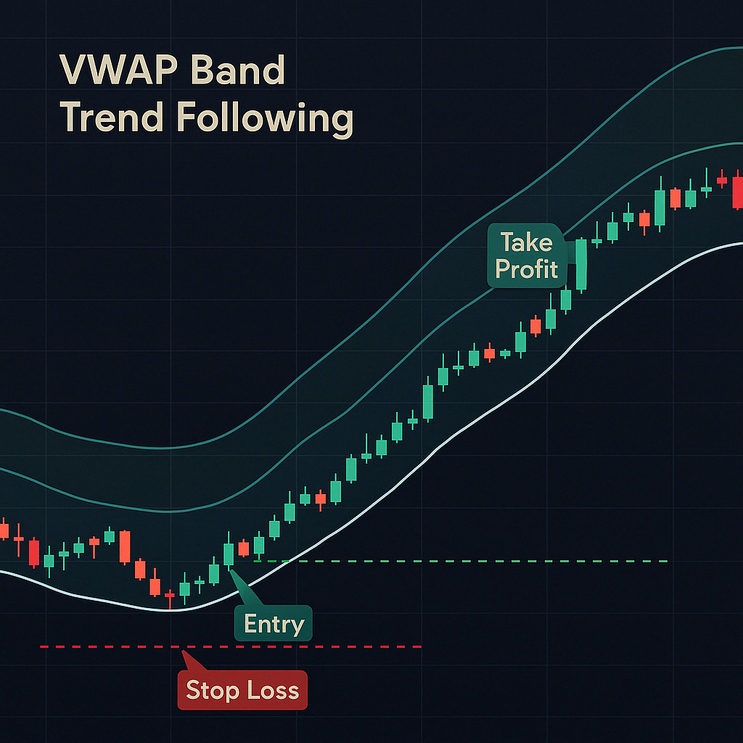
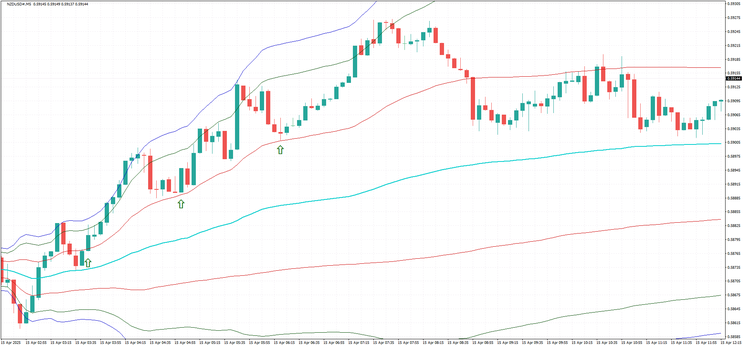
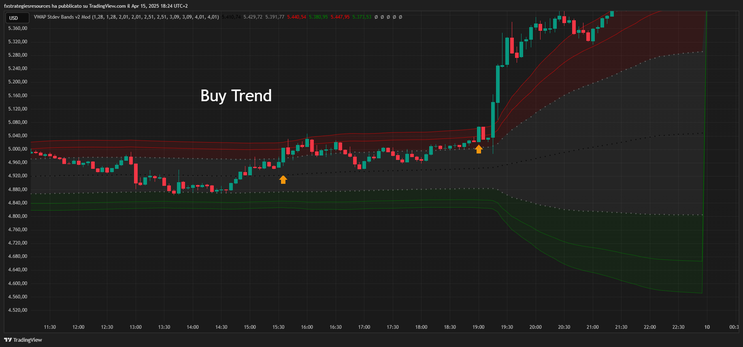
Entry: Price breaks above +1σ or +2σ VWAP band.
Confirm: Strong bullish breakout candle with high volume.
Entry: Pullback to +1σ or VWAP.
Stop Loss: Below VWAP or low of breakout candle.
Take Profit: +2σ or predefined risk/reward.
Short Setup (Bearish Trend)
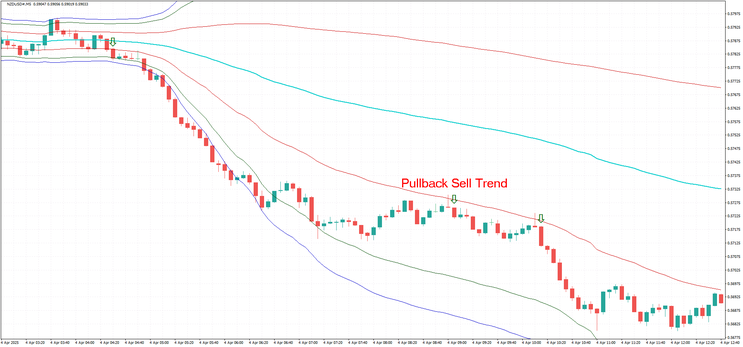
Entry: Price breaks below –1σ or –2σ VWAP band.
Confirm: Strong bearish breakout candle with high volume.
Entry: Pullback to –1σ or VWAP.
Stop Loss: Above VWAP or high of breakout candle.
Take Profit: –2σ or predefined risk/reward.
Strategy Logic
This approach aims to capture momentum as the price pushes away from the mean (VWAP) with strength. The VWAP bands serve as dynamic support and resistance zones, helping confirm both breakout and pullback levels.
Long Setup (Oversold Reversal)
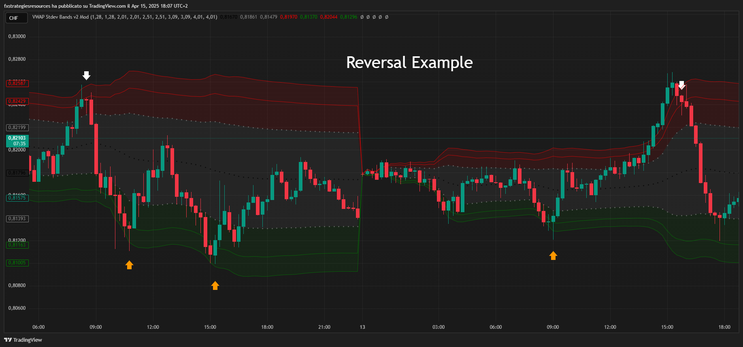
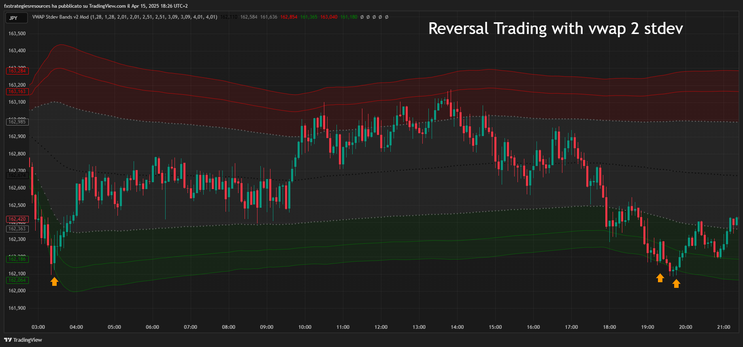
Entry: Price touches or pierces –2σ or –3σ VWAP band.
Confirm: Reversal pattern (e.g. hammer, bullish engulfing).
Entry: On bullish signal candle.
Stop Loss: Just below –3σ or recent swing low.
Take Profit: VWAP (mean reversion).
Short Setup (Overbought Reversal)
Entry: Price touches or pierces +2σ or +3σ VWAP band.
Confirm: Bearish pattern (e.g. shooting star, bearish engulfing).
Entry: On bearish signal candle.
Stop Loss: Just above +3σ or recent swing high.
Take Profit: VWAP.
Strategy Logic
This strategy capitalizes on mean reversion — the idea that prices tend to return to a fair value after excessive movement. VWAP bands help traders time entries during sharp downward spikes, providing structure to an otherwise risky reversal setup.
⚖️ Comparison
|
Feature |
Trend Following (VWAP Trend Rider) |
Reversal (VWAP Snapback) |
|---|---|---|
|
Market Condition |
Trending (strong direction) |
Ranging or overextended |
|
Risk Profile |
Moderate (trend continuation) |
Higher (catching falling knife) |
|
Reward Profile |
Can catch large moves |
Faster but smaller gains |
|
Entry Frequency |
Moderate |
High (more setups) |
|
Ideal Volume |
High/increasing |
Spikes followed by fade |
|
Stop Placement |
Logical (below trend) |
Tight, needs discipline |
|
Drawdown Risk |
Lower in strong trend |
Higher during trend continuation |
|
Psychology |
Patience for pullbacks |
Quick reaction and confidence |
Tips & Best Practices
-
Use volume as confirmation: Especially for breakouts, above-average volume strengthens the signal.
-
Avoid low-liquidity sessions: VWAP is volume-sensitive; use it during active market hours.
-
Always wait for the pullback in trend-following setups — chasing price can lead to poor entries.
-
Combine VWAP with price action like candlestick patterns for more confluence.
-
Backtest on your platform before going live — performance can vary slightly between MT4, MT5, and TradingView due to VWAP calculation methods.
Common Mistakes to Avoid
-
Entering too early before confirmation (e.g., entering before price breaks the VWAP band).
-
Placing wide stop losses without respecting structure or volatility.
-
Forcing trades in choppy or low-volume markets.
-
Ignoring the broader trend — reversal strategies work best against sharp but temporary moves, not sustained downtrends.
-
Overusing VWAP bands on every timeframe — stick to one or two key timeframes to avoid confusion.


Institutional Price Action: A Deep Dive into the QuantFlow Precision Fibonacci VWAP -TradingView-
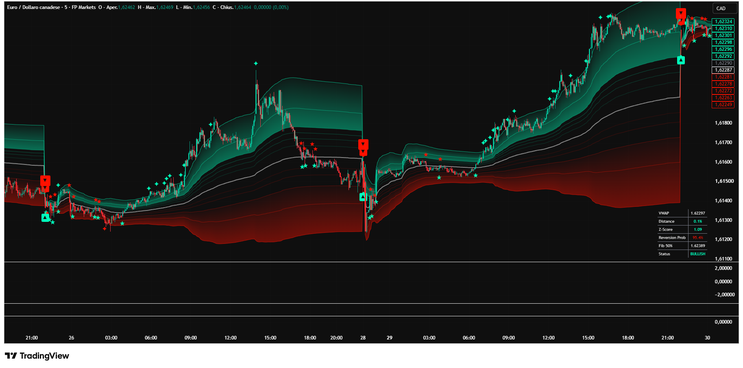
Emiliano, Quantitative Trader, 2026
Enter the QuantFlow Precision Fibonacci VWAP, a professional-grade institutional trading suite available on TradingView. This indicator doesn't just show you where the price is; it reveals where institutional money is concentrated by merging MIDAS volume-weighting with Gaussian statistical probability and Fibonacci expansion theory.
If you are looking to map out market structure, volatility, and high-probability reversal zones, here is everything you need to know about this powerful tool.
The Quantitative Core: The MIDAS Engine
Unlike a simple VWAP, QuantFlow Precision utilizes the MIDAS (Multidaily Institutional Digital Analysis Support) approach. It calculates the cumulative volume-weighted price from a specific "Anchor Point." This reveals the true average price where institutional orders are concentrated, giving you a real-time map of "Fair Value."
Adaptive Anchoring
The indicator features an intelligent "Auto" mode that adjusts to your specific trading style based on your timeframe:
-
Scalping (1m–15m): Resets daily to capture intraday liquidity flows.
Intraday (15m–1h): Resets weekly to identify the current week's fair value.
Swing (Daily+): Resets monthly or yearly for long-term trend benchmarks.
Alternatively, you can use a Manual Anchor Date to track volume profiles starting from specific macroeconomic events, such as FOMC meetings, CPI releases, or major earnings reports.
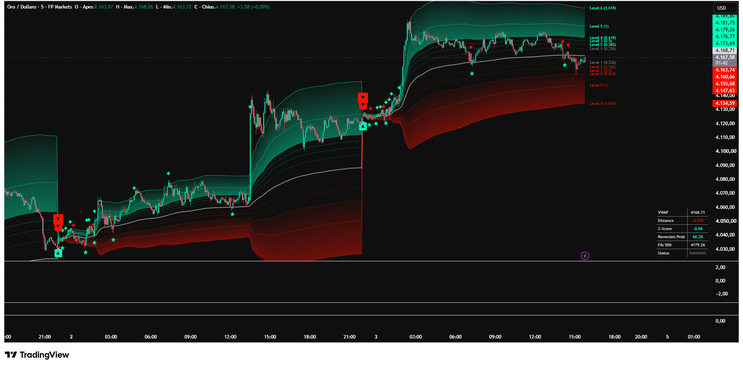
Mapping Volatility with Fibonacci Bands
One of the standout features of QuantFlow is its 6 levels of Fibonacci-weighted bands, which expand and contract dynamically with market volatility. These act as institutional support and resistance zones:
-
Inner Bands (Levels 1-2): Define the "Equilibrium Zone." When the price stays here, the market is ranging or consolidating.
Expansion Bands (Levels 3-4): Represent confirmed trend momentum.
Extreme Bands (Levels 5-6): These correspond to the 1.0 and 1.618 Fibonacci extensions. When the price reaches these levels, it enters a "statistical extreme," often preceding a sharp mean-reversion.
The Gaussian Probability Dashboard
Trading is about probabilities, and this indicator provides a real-time "heads-up display" (HUD) of the market's statistical state:
-
Z-Score Analysis: Measures how many standard deviations the price has moved from the mean. A Z-Score > 2.0 indicates a move that occurs less than 5% of the time—a massive clue for a potential reversal.
Reversion Probability: Uses the 68-95-99.7 rule to estimate the likelihood of the price returning to the VWAP. When this hits 99%, the market is at a historical breaking point.
Distance %: Shows the exact percentage gap between the current price and "Fair Value."
Visual Intelligence for High-Speed Decisions
The indicator is designed with a high-contrast UI to help you make split-second decisions without cluttering your chart:
-
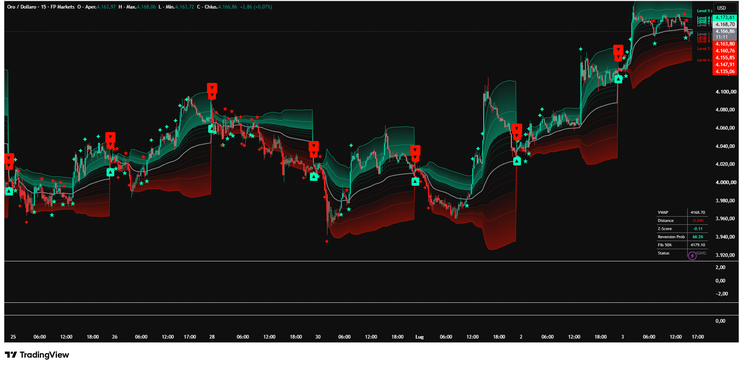
Color-Coded Candles: Fluor Green indicates confirmed bullish momentum (Price > Upper Fib 1). Fluor Red shows confirmed bearish momentum. Grey means the market is in "No-Man's Land" (ranging).
Crossover Stars (★): Tiny stars appear when the price reclaims or loses the VWAP line, signaling an immediate shift in institutional control.
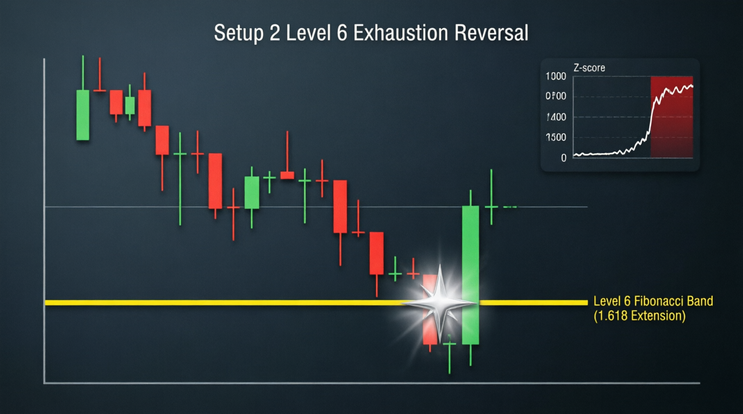
Extreme Sparkle Markers (✦): These high-contrast markers trigger when the price pierces the Level 6 (1.618) band. They represent statistical exhaustion points—the most extreme 1% of volatility—signaling a high-probability reversal zone.
How to Trade with QuantFlow: The Complete Buy & Sell Playbook
Knowing where the institutional money is sitting is only half the battle. The real edge comes from combining the visual signals (Candles, Stars, and Sparkles) with the statistical extremes. Here are the three highest-probability setups to execute long (buy) and short (sell) trades.
How to Trade with QuantFlow: The Complete Buy & Sell Playbook
Knowing where the institutional money is sitting is only half the battle. The real edge comes from combining the visual signals (Candles, Stars, and Sparkles) with the statistical extremes. Here are the three highest-probability setups to execute long (buy) and short (sell) trades.
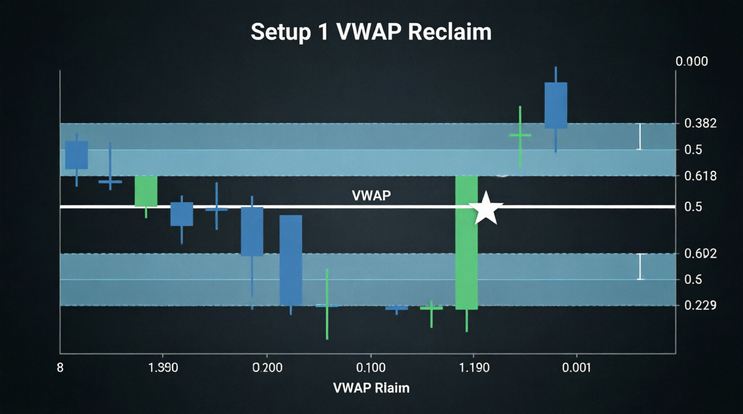
Setup 1: The Institutional VWAP Reclaim (Trend Continuation)
This is your bread-and-butter strategy for trending markets. Institutions use the central VWAP as a dynamic support/resistance level to add to their positions.
🟢 BUY (Long):
-
The Setup: The overall trend is bullish, and candles are Fluor Green. The price pulls back and touches the central MIDAS VWAP line.
The Trigger: Wait for a Fluor Green candle to close back above the VWAP, ideally accompanied by a Crossover Star (★).
Stop Loss: Just below the VWAP line or the recent swing low.
Take Profit: Scale out at the Upper Expansion Bands (Level 3 or 4).
🔴 SELL (Short):
-
The Setup: The overall trend is bearish (Fluor Red candles). Price rallies up to test the central MIDAS VWAP.
The Trigger: Wait for a Fluor Red candle to close below the VWAP with a Crossover Star (★).
Stop Loss: Just above the VWAP line.
Take Profit: Scale out at the Lower Expansion Bands (Level 3 or 4).
Setup 1 Pro-Tips:
Best used in clear, established trends. Avoid this setup if the market is heavily chopping back and forth across the VWAP
Look for a spike in volume on the exact candle that reclaims the VWAP for extra confirmation.
Setup 2: The Level 6 Exhaustion Reversal (Mean Reversion)
Setup 2 Level 6 Exhaustion Reversal]
This is a counter-trend strategy used when the market becomes irrationally overbought or oversold. It relies on the "rubber band" effect of the extreme Fibonacci bands and Gaussian probabilities.
🟢 BUY (Long):
-
The Setup: Price crashes aggressively into the Lower Level 6 Fibonacci Band. Check the HUD: the Z-Score should be below -2.0, and the Reversion Probability should be nearing 99%.
The Trigger: Look for the Extreme Sparkle Marker (✦). Do not catch the falling knife! Wait for the very first Fluor Green candle to print, signaling that buyers have stepped in.
Stop Loss: A safe distance below the Level 6 band (give the trade room to breathe).
Take Profit: The central MIDAS VWAP line (Fair Value).
🔴 SELL (Short):
-
The Setup: Price spikes violently into the Upper Level 6 Band. Z-Score is > 2.0.
The Trigger: The Extreme Sparkle Marker (✦) appears. Wait for the first Fluor Red candle to close, confirming exhaustion.
Stop Loss: Above the Level 6 band.
Take Profit: The central MIDAS VWAP line.
Setup 2 Pro-Tips:
-
Strictly a counter-trend play. Do not use this setup if the higher-timeframe trend is completely parabolic and showing no signs of slowing down.
For maximum safety, wait for a bearish/bullish engulfing candle pattern at the Level 6 band before pulling the trigger.
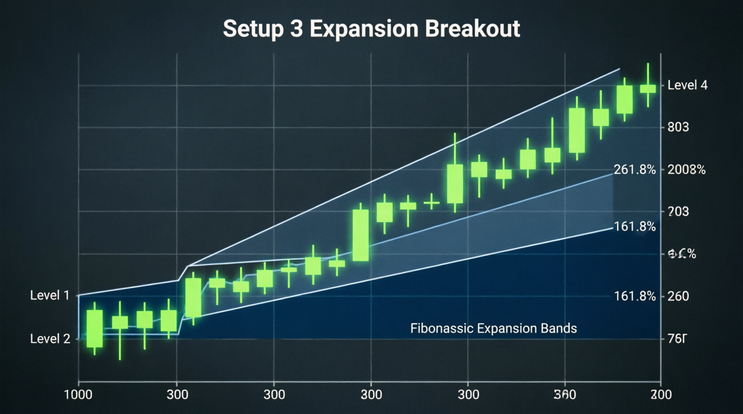
Setup 3: The Expansion Breakout (Momentum Riding)
Setup 3 Expansion Breakout]
This setup is for catching explosive moves when the price leaves the "Equilibrium Zone" (Inner Bands 1 and 2) and enters the "Expansion Zone."
BUY (Long):
-
The Setup: Price breaks out of the inner consolidation bands and closes strongly above Level 2 with Fluor Green candles.
The Trigger: Enter on the retest of Level 2, or enter at the market as soon as the candle closes past Level 3.
Trailing Stop: Move your Stop Loss up to just below the Level 2 band. As long as the candles remain Fluor Green, stay in the trade. Exit when the candle color turns Grey (No-Man's Land).
SELL (Short):
-
The Setup: Price breaks down below the inner bands and closes below Level 2 with Fluor Red candles.
The Trigger: Enter on the retest of Level 2 from underneath, or upon the break of Level 3.
Trailing Stop: Trail your stop just above the Level 2 band. Exit when candles turn Grey.
Setup 3 Pro-Tips:
-
Works exceptionally well on higher timeframes (15m, 1h, 4h) where breakouts are more reliable.
The breakout is significantly stronger if you see increasing volume as the price crosses Level 2.
Crucial: Do not enter this setup if the price is already extended and hovering near Level 5 or 6. You want to catch the move as it leaves the equilibrium, not when it's already exhausted.
Golden Rules for Execution
-
Never trade against the Candle Color: If you are looking for a Buy setup, but the candles are Fluor Red or Grey, sit on your hands. The color confirms the momentum.
-
Context is King: The Auto-Anchor feature is great, but for major news days (like NFP or CPI), use the Manual Anchor at the time of the news release to track the true institutional volume profile.
-
Avoid the "Chop": If the price is constantly crossing the VWAP back and forth and candles are Grey, the market is ranging. Switch to the Level 6 Mean Reversion strategy, or better yet, stay out of the market.
-
Always Wait for Confirmation: Don't anticipate the signal. Wait for the candle to CLOSE and for the visual markers (★ or ✦) to appear before entering.
-
Risk Management: Never risk more than 1-2% of your account on a single trade, regardless of how strong the signal appears.
Trading Styles Adaptation
Depending on your trading style, you can adapt the indicator to fit your strategy:
-
The Scalper: Use the Daily Auto Anchor to trade mean-reversions. Look for the Level 6 sparkle (✦) markers during high-volatility sessions to catch the snap-back to the mean.
The Trend Trader: Enter trades when the candles shift to Fluor Green or Red, and use the MIDAS VWAP as a dynamic trailing stop to ride the momentum safely.
The Swing Trader: Set a Manual Anchor Date on a major news event to track the long-term institutional volume profile and trade the macro trend over several weeks.
Final Thoughts
The QuantFlow Precision Fibonacci VWAP is more than just a chart overlay; it is a comprehensive quantitative framework. By combining institutional volume tracking with statistical extremes, it bridges the gap between raw price action and mathematical probability.
Whether you are scalping the 1-minute chart or swing trading the daily, this tool provides the institutional edge you need to navigate the markets with confidence. Master these three setups, follow the golden rules, and you'll be trading with the same tools as the professionals.
Source & Credits: Ready to start trading with institutional precision? You can find this powerful indicator directly on the TradingView community library.
🔗 Get the Indicator: QuantFlow: Precision Fibonacci VWAP
42# Faizumi 2.1 modified Trading System
Submit by Forexstrategiesresources
Faizumi 2.1 modified is new version of popular trading system, Faizumi.
Time Frame: 4H .
Pair:all.
Metatrader Indicators:
Advance ADX
ADXhds
THV Mtf bar
Gold Finger
Long Entry:
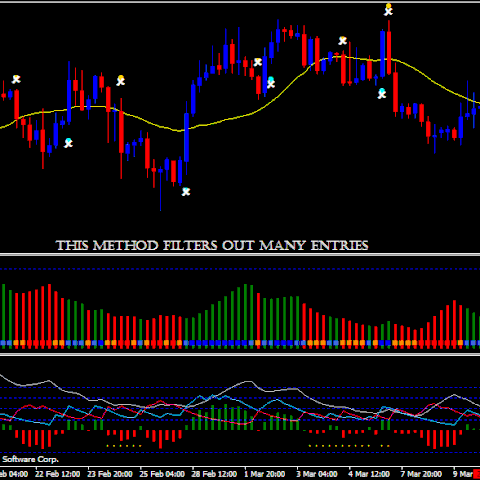
When Appairs Gold Fnger signal buy and ADX advanced is greater than the previous bar and ADXhds is green.
Short Entry:
When Appairs Golden Finger signal sell and ADX advanced is greater than the previous bar and ADXhds is red.
Exit:
place stop loss at higher or lower previus of entry;
trailing stop;
profit target;
reversal Gold Finger signal.
In the picture Faizumi forex system in action.
190# DOLLY + ISAKAS + NINA - Forex Strategies - Forex
284# ISAKAS CS - Forex Strategies - Forex Resources - Forex ...
53# Isakas Sekelper - Forex Strategies - Forex Resources - Forex
172# ISAKAS Rebirth - Forex Strategies - Forex Resources - Forex
173# Trading System, ISAKAS II V.2 - Forex Strategies - Forex ...
171# ISAKAS II - Forex Strategies - Forex Resources - Forex
165# Isakas Osentogg - Forex Strategies - Forex Resources -
335# Dolly 10,11,12 - Forex Strategies - Forex Resources - Forex
190# DOLLY + ISAKAS + NINA - Forex Strategies - Forex
310# Dolly 13 - Forex Strategies - Forex Resources - Forex Trading
257# Dolly 2 - Forex Strategies - Forex Resources - Forex Trading
32# Dolly Modified - Forex Strategies - Forex Resources - Forex ...
318# Ultima Secret V.1 - Forex Strategies - Forex Resources -
339# Gold Miner and Stochbars Strategy - Forex Strategies - Forex
20# Fx Faizumi - Forex Strategies - Forex Resources - Forex
Trading System Metatrader 4 III
