

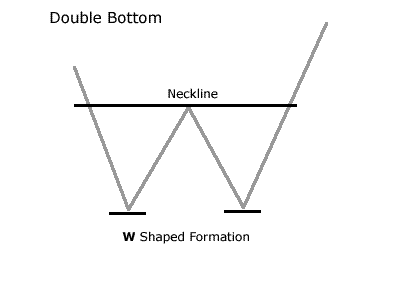
12# Double Bottom (Reversal Pattern)

Double Bottom formation is in many ways the mirror image of the Double Top. After an extended decline to new lows a stock puts-in a bottom on massive volume and a moderate rally ensues. After several sessions (sometimes weeks) the stock drifts back to test the first bottom but this time buying accelerates and another rally occurs.
Technical target is derived by adding the difference between bottom #1 and the reaction high to the new breakout level. After the second bottom has been created, the newbreakout level is the reaction high. No double bottom formation is complete until the stock rallies through this level.
• For double bottoms volume must increase as the stock moves toward the first and second bottoms. In many cases, volume will actually be higher at the first bottom because this is where value-oriented
investors first take positions.
• No double bottom pattern is truly valid until the stock moves through the reaction high.
• Upside breakouts through the reaction high often lead to small 2-3% advances followed by an immediate test of the breakout level. If the stock closes below this level (now support) for any reason the pattern becomes invalid.
• Technical targets are implied but they are by no means assured. Targets are guideposts only.
Double Tops are all about distribution, Double Bottom is about accumulation. After an extended decline characterized by aggressive short-selling and valuation concerns, value-oriented investors with longer-term time horizons begin to take positions in the stock. They understand that the only way to build a large position in a stock that they like is to do so when selling predominates. It is their willingness to buy the stock when all of the news is bad that creates a clear support level, the first bottom
(bottom #1).
This first part of the pattern will normally be sufficient to force many professional short sellers (bears) to cover positions. This
coupled with buying from longer-term value investors may be enough to rejuvenate investors that recently purchased the stock at
higher levels -- they may even rationalize that the "market" is finally beginning to realize that the current weakness is without
merit a few bullish speculators may be enticed to take new long positions. Unfortunately, after several sessions of positive price
action buying pressures are exhausted and the stock once again begins to falter. The reaction to the decline that formed bottom #1
is complete. Technical traders call this the reaction high.
Sensing easy profits, short sellers return and bullish speculators decide to take profits, modest selling becomes a route. As the stock approaches bottom #1 volume remains light and in many cases the stock will actually fall through the previous low on very light volume.
It is at this point in time that pessimism is greatest, there seems to be no legitimate reason to continue holding the stock. Novice short sellers add new short positions and beleaguered bulls who purchased the stock at much higher levels begin to surrender in anticipation of a new leg lower. However the expected big decline never materializes, selling pressures have been exhausted and this is when professional short sellers realize the "jig is up".
It is the new buying by bearish investors to cover short positions to capture profits and the continued accumulation by longerterm investors that helps the stock stabilize. As a second bottom (bottom #2) begins to take shape the pace of short covering accelerates and a new group of bullish speculators take long positions, the rally explodes. On the chart two equal bottoms are created, the double bottom is in place. In many cases double bottoms lead to important rallies because a vital support level has been established.
Double bottom occurs when prices form two distinct lows on a chart. A double bottom is only complete, however, when prices rise above the high end of the point that formed the second low.
The double bottom is a reversal pattern of a downward trend in a stock's price. The double bottom marks a downtrend in the process of becoming an uptrend.
Double bottoms are often seen and are considered to be among the most common of the patterns. Because they seem to be so easy to identify, the double bottom should be approached with caution by the investor.
The double bottom is a "much misunderstood formation." Many investors assume that, because the double bottom is such a common pattern, it is consistently reliable. This is not the case. Bulkowski estimates the double bottom has a failure rate of 64%, which he terms surprisingly high. If an investor waits for a valid breakout, however, the failure rate declines to 3%.
The double bottom is a pattern, therefore, that requires close study for correct identification.
What are the details that I should pay attention to in the double bottom?
1. Downtrend Preceding Double Bottom
As mentioned previously, the double bottom is a reversal formation. It begins with prices in a downtrend. Bulkowski cautions that on their way down, prices should not drift below the left low of the pattern.
2. Time between Bottoms
Analysts pay close attention to the "size" of the pattern - the duration of the interval between the two lows. Generally, the longer the time between the two lows, the more important the pattern as a good reversal. Analysts suggest that investors should look for patterns where at least one month elapses between the bottoms. It is not unusual for a few months to pass between the dates of the two bottoms.
3. Increase from First Low
Some analysts argue the increase in price that occurs between the two bottoms should be consequential, amounting to approximately 20% of the price. Other analysts are not so definite or demanding concerning the price increase. For some, an increase of at least 10% is adequate.
4. Volume
As mentioned previously, volume tends to be heaviest during the first low, lighter on the second. It is common to see volume pick up again at the time of breakout.
5. Decisive Breakout
It is a challenge for the analyst to determine whether the rise from the bottom is the indication of the development of a valid double bottom or simply a temporary setback in the progression of a continuing downtrend. Analysts, therefore, advise cautious investors to wait for the price to rise back up and break through the confirmation point before relying on the validity of the pattern. Many experts will maintain that an investor should wait for a decisive breakout, confirmed by high volume.
A pullback after the breakout is usual for a double bottom. Bulkowski estimates that in 68% of double bottom patterns, price will throwback to the breakout price.
Are there variations in the pattern that I should know about?
1. Two Lows at Different Levels
Sometimes the two lows comprising a double bottom are not at exactly the same price level. This does not necessarily render the pattern invalid. Analysts advise that if the second low varies in price from the first low by more than 3% or 4%, the pattern may not be a double bottom.

Write a comment