

16# Head & Shoulders Top (Reversal Pattern)

Head and Shoulders top pattern is a rally to a new high and weakness to intermediate support, a second rally to a higher high and decline to support, followed by a modest third rally and decline through support.
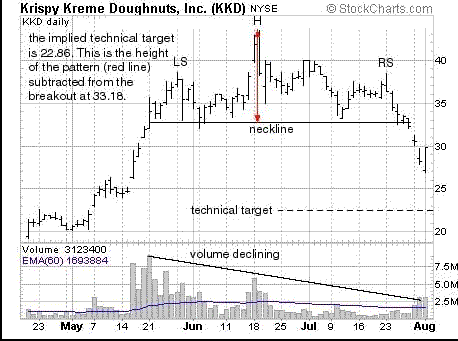
The technical target is derived by subtracting the difference between the highest level achieved in the formation of the"head" and the level of the "neckline" from the new breakout level.
• Symmetry is important. The most reliable head and shoulders top patterns are symmetrical, that is the left and right shoulders take shape over the roughly the same number of days. Patterns with extended right shoulders should be avoided.
• It is important that volume decline on each successive rally in the head and shoulders top pattern. The
weak volume and rising price is a good indication that distribution is at work.
• No pattern is truly complete until there is a breakout close below the neckline of the pattern.
• Downside breakouts often lead to small 2-3% declines followed by an immediate test of the breakout level. If the stock closes above this level (now resistance) for any reason the pattern becomes invalid.
Head and Shoulders patterns are among the most important of reversal patterns because they are both common and reliable. The head and shoulder top pattern consists of three rallies and a breakout. The reversal pattern gets its name because the middle rally reaches the highest point while both the first and third rallies are approximately equal in height. The left shoulder of a head and shoulders top pattern will always take shape after an extended rally to new highs. Buyers seem willing to pay increasingly exorbitant prices because all of the fundamental data is perceived to be improved.
After one particularly bullish report the stock surges to a new high on strong volume as analysts pound the table with new "buy" recommendations but days later profit taking leads to a modest reactionary pullback (reaction low). Bullish investors and analysts rationalize that the weakness is just normal profit taking after a lengthy advance and they are partly correct --the selling is profit taking but it is far from normal.
On this first pullback those investors that bought the stock at lower prices begin distributing their stock into the good news, they have made their money and they want out. As the stock declines buyers regroup and the torrid rally resumes.
Because all of the fundamental news remains bullish, the next rally to new highs easily exceeds the first. The stock very quickly rallies to a fresh new high but there is just one problem, despite the barrage of positive corporate news and Wall Street cheer, volume declines relative to the initial rally.
As the stock continues to move higher selling by investors that purchased the stock at lower prices intensifies and it is not
long before the imbalance between buyers and sellers causes a considerable decline. Rumors begin to swirl that institutions and insiders are selling. Days later the stock drifts back to test the reaction low and volume surges. This price action forms the head of the pattern. As the stock tests its reaction lows positive news hits the tape and buyers return.
A third rally begins amidst new "buy" recommendations from Wall Street analysts. Unfortunately, the third rally is even more feeble than the previous two moves higher. The stock does advance but volumes slows to a trickle and it becomes clear that the stock is being distributed. After several more sessions the stock begins to decline yet again and a move back to support at the reaction lows ensues. In keeping with the imagery of the pattern, this key support level is often called the neckline of the head and shoulder top pattern. The third decline to this level completes the right shoulder of the pattern. As the stock approaches support for a third time positive comments from Wall Street analysts continue but this time buyers are overwhelmed by sellers, volume expands and the stock collapses. Weeks later the stock trades back to longer-term support.
The head and shoulders top is an extremely popular pattern among investors because it's one of the most reliable of all formations. It also appears to be an easy one to spot. Novice investors often make the mistake of seeing Head and Shoulders everywhere. Seasoned technical analysts will tell you that it is tough to spot the real occurrences.
The head and shoulders top is a "reversal" pattern. The formation marks a reversal in an upward trend of the stock's price - an uptrend is in the process of becoming a downtrend.
What does a classic head and shoulders top look like?
The classic head and shoulders top looks like a human head with shoulders on either side of the head. A perfect example of the pattern has three sharp high points, created by three successive rallies in the price of the stock.
The first point - the left shoulder - occurs as the price of the stock in a rising market hits a high and then falls back. The second point - the head - happens when prices rise to an even higher high and then fall back again. The third point – the right shoulder - occurs when prices rise again but don't hit the high of the head. Prices then fall back again once they have hit the high of the right shoulder. The shoulders are definitely lower than the head and, in a classic formation, are often
roughly equal to one another. A key element of the pattern is the neckline. The neckline is formed by drawing a line connecting two low price points of the formation. The first low point occurs at the end of the left shoulder and the beginning of the uptrend to the head. The second marks the end of the head and the beginning of the upturn to the right shoulder. The neckline can be horizontal or it
can slope up or down. The pattern is complete when the support provided by the neckline is "broken." This occurs when the price of the stock, falling from the high point of the right shoulder, moves below the neckline. Technical analysts will often say that the pattern is not confirmed until the price closes below the neckline - it is not enough for it to trade below the neckline.
What are the details that I should pay attention to in the head and shoulders top?
1. Symmetry - The right and left shoulders should peak at approximately the same price level. In addition, the shoulders are often about the same distance from the head. In other words, there should be about the same amount of time between the development of the top of the left shoulder and the head as between the head and the top of the right shoulder. In the real world, the formation will seldom be perfectly symmetrical.
2. Volume -Volume should be highest on the left shoulder, lowest on the right shoulder and somewhere in between on the head. The real tip-off in this formation occurs when activity fails to rally on the right shoulder.
3. Duration of the Pattern - An average pattern takes at least three months from start to the breakout point when the neckline is broken. It is not uncommon, however, for a pattern to last up to six months. The duration of the pattern is sometimes called the "width" of the pattern.
4. Need for an Uptrend - This is a reversal pattern which marks the transition from an uptrend in prices to a downtrend.
This means that the formation always begins during an uptrend of stock prices.
5. Slope of the Neckline - The neckline can slope up or down. The direction of the slope tends to predict the severity of the price decline. An upward sloping neckline is considered to be more bullish than a downward sloping one, which indicates a weaker situation with more drastic price declines.
6. Decisive Neckline Break - To be complete, the neckline must be decisively broken. If the support at the neckline holds - if price bounces around the neckline or fails to move below the neckline - this is a sign that the reversal pattern has failed. If the pattern fails to decisively break through the neckline, prices will often move higher as the rally continues.
Are there variations in the pattern that I should know about?
There are a few notable variations.
Watch for the Drooping Shoulder
The drooping shoulder - where neckline has a downward slope - can often indicate a rapidly developing technical weakness. The droop happens because the stock price at the end of the head and the beginning of the right shoulder have dropped even lower than the previous low at the end of the left shoulder and the beginning of the head. Most experts agree that a downward slope has bearish implications for market weakness. Typically when the right shoulder is drooping, the trader will have to wait longer than usual for a decisive neck break.
Varying Width of Shoulders
The classic head and shoulders top is symmetrical. However, if the shoulders don't match in width, don't discount the pattern. According to Schabacker, it's common for one shoulder to take longer to form than the other.11 If the pattern decisively breaks the neckline, it's still a valid head and shoulders top.
Flat Shoulders
While the classic head and shoulders top is made up of three sharp upward points, these need not be present for the pattern to be valid. Sometimes, shoulders can be rounded.
Multiple Head and Shoulders Patterns
Many valid head and shoulders patterns are not as well defined as the classical head with a shoulder on either side.
"Complex" formations can have more variations than the classical formation. It is not uncommon to see more than two shoulders and more than one head.
