

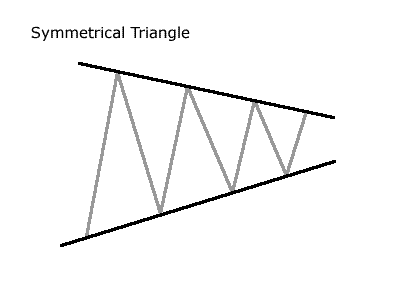
Symmetrical Triangle (Continuation Pattern)
Generally, a triangle pattern is considered to be a continuation or consolidation pattern. Sometimes, however, the formation marks a reversal of a trend.
Symmetrical triangles are generally considered neutral. From a time perspective, triangles are usually considered to be intermediate patterns. Usually, it takes longer than a month to form a triangle. Seldom will a triangle last longer than three
months.
Generally, a triangle pattern is considered to be a continuation or consolidation pattern. Sometimes, however, the formation marks a reversal of a trend.
Symmetrical triangles are generally considered neutral. From a time perspective, triangles are usually considered to be intermediate patterns. Usually, it takes longer than a month to form a triangle. Seldom will a triangle last longer than three months.
Their uncertainty is marked by their actions of
buying and selling sooner, making the pattern look like an increasingly tight coil moving across the chart. As the range between the peaks and troughs marking the progression of price narrows, the trendlines meet at the "apex,"
located at the right of the chart. The "base" of the triangle is the vertical line at the left of the chart which measures the vertical height of the pattern.
Why is the symmetrical triangle pattern important?
A symmetrical triangle pattern is relatively easy to identify. In addition, triangle patternscan be quite reliable to trade with very low failure rates. There is a caution concerning trading these patterns a triangle pattern can be either continuation or
reversal patterns. Typically, they are continuation patterns. To achieve the reliability for which the triangle is well known, technical analysts advise waiting for a clear breakout of one of the trendlines defining the triangle.
Triangle patterns are usually susceptible to definite and dependable analysis, with the proviso that the investor must wait for a reliable, as opposed to a premature, breakout.
Is volume important in a symmetrical triangle pattern?
Volume is an important factor to consider when determining whether a formation is a true triangle. Typically, volume follows a reliable pattern: volume should diminish as the price swings back and forth between an increasingly narrow range
of highs and lows. However, when breakout occurs, there should be a noticeable increase in volume. If this volume picture is not clear, investors should be cautious about whether the pattern is a true triangle.
What are the details that I should pay attention to in a symmetrical triangle pattern?
1. Occurrence of a Breakout - Technical analysts pay close attention to how long the triangle takes to develop to its apex.
The general rule is that prices should break out - clearly penetrate one of the trendlines - somewhere between three-quarters and two-thirds of the horizontal width of the formation. The break out, in other words, should occur well before the pattern
reaches the apex of the triangle.
To take the measurement, begin by drawing the two converging trendlines. Measure the length of the triangle from its base to the apex. Next, plot the distance along the horizontal width of the pattern where the breakout should take place. If prices
remain within the trendlines beyond the three-quarters point of the triangle, technical analysts will approach the triangle with caution.
2. Price Action - Unlike ascending and descending triangles which give advance notice of their intentions, the symmetrical triangle tends to be a neutral pattern. The symmetrical triangle is generally a consolidation pattern. This means an investor
can look to see the direction of the previous trend and make the basic assumption that the trend will continue. However, many experts advise investors that because the breakout direction could go either way that they wait until the breakout
occurs before investing in or selling the stock.
3.Measuring the Triangle - To project the minimum short-term price objective of a triangle, an investor must wait until the price has broken through the trendline. When theprice breaks through the trendline, the investor then knows whether the
pattern is a consolidation or a reversal formation.
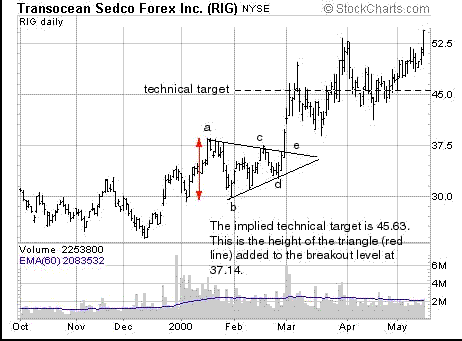
To calculate the minimum price objective, calculate the "height" of the formation at its widest part - the "base" of the triangle. The height is equal determined by projecting a vertical line from the first point of contact with the trendline on the
left of the chart to the next point of contact with the opposite trendline. In other words, measure from the highest high point
on one trendline to the lowest low point on the opposite trendline. Both these points will be located on the far left of the
formation. Next, locate the "apex" of the triangle (the point where the trendlines converge). Take the result of the measurement of the height of the triangle and add it to the price marked by the apex of the triangle if an upside breakout
occurs and subtract it from the apex price if the triangle experiences a downside breakout.
5. Forecasting Implications - Once breakout occurs, the symmetrical triangle tends to be a reliable pattern.
6. Shape of Symmetrical Triangle - The pattern should display two highs and two lows, all touching the trendline – a minimum of four reversal points is necessary to draw the two converging trendlines.
7. Volume - Investors should see volume decreasing as the pattern progresses toward the apex of the triangle. At breakout,
however, there should be a noticeable increase in volume.
8. Premature or False Breakouts - Triangles are among the patterns most susceptible to this phenomenon. Because the pattern can be either a reversal or continuation pattern, investors are particularly susceptible to false moves or, at the very
least, confused by them. In addition, because volume becomes so thin as the triangle formation progresses to the apex, it takes very little activity to bring about an erratic and false movement in price, taking the price outside of the trendlines.
Symmetrical triangle is a rally to a relative new high, a pullback to an intermediate term support level, a second rally that does not exceed the recent high, a second decline that falls short of the intermediate term support level followed by a
breakout on strong volume above the trend lines created by joining the new high and the secondary high.
Technical targets for symmetrical triangles are derived by adding the largest vertical height of the triangle to the ultimate
breakout level.
• Symmetrical triangles are about growing consensus among traders so a breakout from the triangle means that one group of investors, (bulls or bears) have been forced to abandon everything they believed about price. This sudden imbalance between supply and demand always leads to a violent
move in price.
• Generally, most issues will record a breakout (either higher or lower) about 2/3 through the pattern. If a stock moved all the way to the apex of the triangle the initial breakout is almost always false and should be avoided.
• Because supply and demand are in equilibrium within the triangle, volume should slow dramatically.
Once a breakout has occurred, volume MUST increase significantly.
• Upside breakouts often lead to small 2-3% rallies followed by an immediate test of the breakout level. If the stock closes below this level (now support) for any reason the pattern becomes invalid.
Most consolidation patterns are about indecision -- traders are uncertain about the near term direction of the stock so they do nothing. Symmetrical triangles are different because when a stock falls into one of these patterns, traders actually behave as though they have reached a consensus regarding price - there is a uniform narrowing of price over time.
Symmetrical triangles usually develop after a stock has had a spectacular move. After reaching a relative new high price momentum may begin to fade modestly and the stock works lower. Because the fundamental news is so strong, Wall Street
analysts will often dismiss this weakness as mere profit taking following a lengthy advance. The stock slips back to an intermediate term support level and price stabilizes.
At this point it is common for the stock to begin moving higher on a positive fundamental development. Perhaps the firm has raised guidance, announced a stock split or unveiled a new product but price slowly begins to move higher. There is
one problem, volume is noticeably lighter than previous rallies. The price rally continues but falls short of the recent new high.
This secondary high will be an important point later in the formation of the pattern. After several days of strength,
momentum once again fades and price begins to falter. Slowly the stock moves lower on no specific news and extremely
light volume. Sensing that sellers may not have an appetite to continue selling buyers reappear and the stock stops short of
the intermediate term support level. This secondary low completes the bottom parameter of a uniform or symmetrical
triangle.
Over time the stock begins to trade in an increasingly narrow range characterized by a series of lower highs and higher lows. As time passes traders grow to believe that the current stock price accurately reflects the true value of the stock.
Volatility and volume slow dramatically as the stock approaches the apex of the triangle. Then, abruptly there is a fundamental development that leads to a dramatic upside breakout.
Volume swells and Wall Street analysts begin making new "buy" recommendations and raising their price targets. As prices moves beyond the upper parameter created by joining the recent new high and secondary high some investors that had felt the stock was fairly priced at lower levels begin selling but their shares are quickly absorbed by buyers. In fact, the demand for the stock becomes so intense that price very quickly surges beyond the recent new high. Weeks later the stock moves significantly higher.
Triangle Forex Strtegies
5# The Symmetrical Triangle Strategy - Forex Strategies - Forex ...
8# Symmetrical Triangle (Continuation Pattern) - Forex Strategies
30# Triangle Trading Method - Forex Strategies - Forex Resources
29# Triangle Breakouts - Forex Strategies - Forex Resources -
6# Ascending Triangle (Continuation Pattern) - Forex Strategies ...
7# Descending Triangle (Continuation Pattern) - Forex Strategies ...
174# Guppy with Triangle Breakout - Forex Strategies - Forex ...

Write a comment