


247# VWAP and TDI for Intraday Trading
Joy22 2026
VWAP and TDI for IntradayTrading. For day traders operating on shorter timeframes (5-minute and 15-minute charts), filtering market "noise" while staying aligned with the dominant institutional flow is paramount. This strategy leverages a longer-term Volume-Weighted Average Price (VWAP) as a directional filter (the "Bias") and the Traders Dynamic Index (TDI) as an entry/exit timing mechanism (the "Trigger").
The Rationale: Why VWAP Weekly on a 5-Minute Chart?
The core principle challenges the standard, daily-resetting VWAP application. A daily VWAP on a 5-minute chart can produce frequent, confusing crossovers during strong multi-day trends. By utilizing a Weekly Anchored VWAP, the indicator transforms into an institutional trend filter.

-
Directional Compass: The Weekly VWAP acts as a solid anchor, representing the average price weighted by volume for the entire week.
-
Reduced Noise: It smooths out the day-to-day volatility, providing a clearer view of whether the "smart money" is leaning bullish or bearish for the current week.
-
The Rule: Price consistently above the Weekly VWAP suggests a macro uptrend; only look for long setups. Price below indicates a macro downtrend; only look for short setups.
The Role of the TDI (Traders Dynamic Index)
The main drawback of using a long-term anchor like the Weekly VWAP on a short-term chart is the potential for the price to remain far from the line for extended periods, making entries difficult. This is where the TDI comes in.
The TDI (an oscillator based on the RSI with volatility bands) provides excellent overbought/oversold and momentum signals on the 5-minute timeframe. It serves as your immediate "trigger," allowing you to time entries without waiting for a potentially non-existent pullback to the far-away Weekly VWAP line.
The Strategy: A Step-by-Step Approach
-
Set up your Charts: Use a 5-minute or 15-minute execution chart. Add the Weekly Anchored VWAP and the TDI indicator.
-
Determine the Bias (The VWAP):
-
Observe the price action relative to the Weekly VWAP line.
If Price > Weekly VWAP, your bias is Long (bullish). Ignore all short signals.
If Price < Weekly VWAP, your bias is Short (bearish). Ignore all long signals.
-
-
Time Your Entry (The TDI):
-
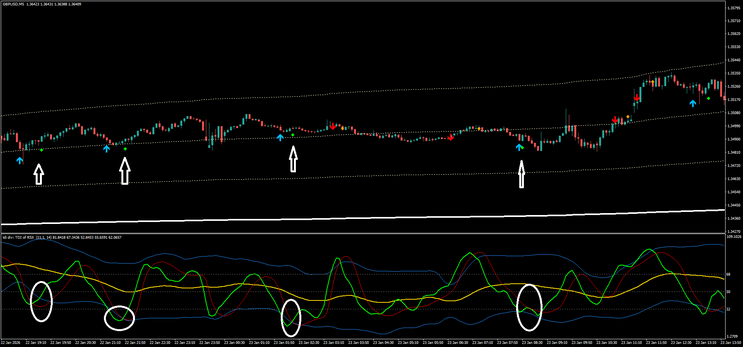
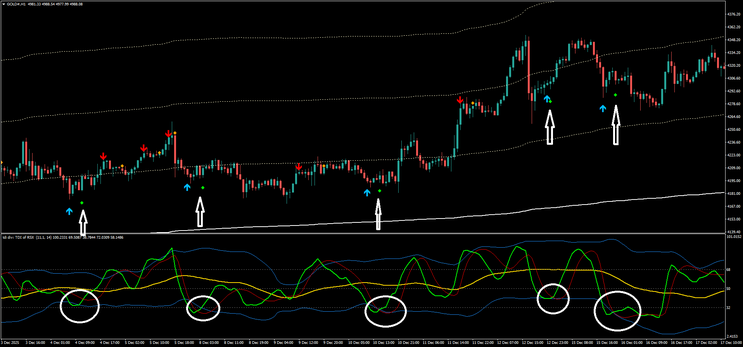
For Long Trades: While your bias is Long, wait for the TDI's green RSI price line to pull back and cross above the red signal line in the lower extreme of its range (an "oversold" signal within a strong uptrend). This is your entry trigger. In this our TDI prints you alert arrow, buy to enter at opening of the next bar when appears the square green.
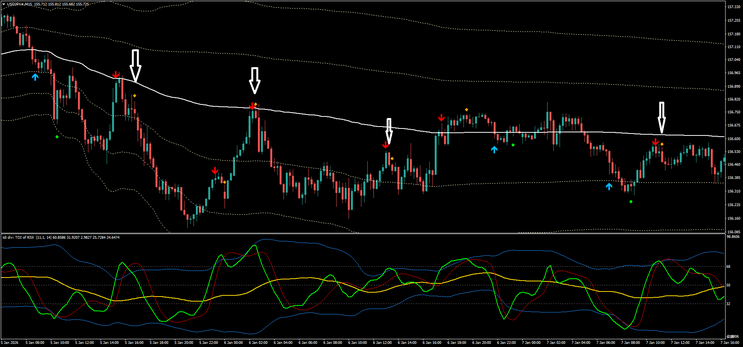
For Short Trades: While your bias is Short, wait for the TDI's green RSI price line to pull back and cross below the red signal line in the upper extreme of its range (an "overbought" signal within a strong downtrend). This is your entry trigger. In this our TDI prints you alert arrow, buy to enter at opening of the next bar when appears the square red.
-
-
Manage Risk: Place your stop-loss order on the opposite side of a recent support/resistance level or slightly beyond a VWAP standard deviation band if you have them enabled. The goal is a favorable risk-reward ratio.
By combining the stability of the Weekly VWAP as a macro filter with the agility of the TDI for timing, traders can filter out low-probability trades and align their execution with the prevailing directional flow.

247# Trendline Scalping
Submit by Nico 04/11/2012
Time Frame 15min;
Currency pairs:any.
Indicators: (TradersCupu indicators)
Doda Bollinger,
Heiken Asci,
Pivot, Support and Resistence
TrendLine
Rules
Open the chart time frame of 60 minutes.
Determine the trend with the indicator trend line. If the price is above the trend line green. the trend is positive. If the price is below the trend line red the trend is negative.
After open the chart timeframe15 min, open a trade only in the direction of the trend of 60 min chart.
Example in the chart EUR/USD to 60 min, the trend is negative. We open the graph 15 minutes here, too, the trend is negative. Selling only Sell.
Example in the chart EUR/USD to 60 min, the trend is positive. We open the graph 15 minutes here, too, the trend is negative. Not trade.
Exit position options:
profit target 12-18 pips depens by currency pairs
take profit on the level pivots points;
exit when appears oppsite dot.
Place Stop loss2 pips above or below dots of Doda Bollinger indicator.
In the pictures Trendline Scalping in action.
22# Trendline Scalper - Forex Strategies - Forex Resources -
78# Advanced Trendline Scalping Strategy - Forex Strategies ...
189# Instant Trendline Filter Scalping - Forex Strategies - Forex ...
6# Trend line Breakout and Fibonacci - Forex Strategies - Forex ...
312# Instant Trendline forex Strategy - Forex Strategies - Forex ...
20#Psych Level Scalping System - Forex Strategies - Forex ...
35# Price Action Fractal Scalping - Forex Strategies - Forex ...
104# Tom De Mark Trend line Strategy - Forex Strategies - Forex
6# Trend line Breakout and Fibonacci - Forex Strategies - Forex ...
116# Trendline Forex Entry Signal, Two High Probability Setups ...
38# Trendline Breakout - Forex Strategies - Forex Resources -
16# Mouteki System - Forex Strategies - Forex Resources - Forex ...
119# Sperandeo Victor, Trendline Method - Forex Strategies -
117# Trendline System - Forex Strategies - Forex Resources -
14# DeMarK System - Forex Strategies - Forex Resources - Forex
8# Trendline Candlestick pattern with Fibo - Forex Strategies
-
