


270# Buy and Sell Signals – TradingView-
Joy22 2025
Buy and Sell Signals indicator for TradingView is designed for scalping or intraday trading on 1-minute or higher timeframes using a TradingView indicator that provides three levels of signal strength:
-
All Signals
Buy & Sell Signals
Strong Signals
Each mode filters signals differently, allowing traders to adapt to market volatility and personal risk tolerance.
1. Indicator Overview
The indicator generates automatic Buy (green) and Sell (red) trade signals.
Each signal includes:
-
A horizontal support/resistance level created by each signal
Color-coded labels for the three signal types
Signal Types
-
All Signals (Most Frequent)
-
Shows every detected Buy and Sell opportunity.
Includes minor signals suitable for fast scalping.
-

-
Buy & Sell Signals (Filtered)
-
Removes weaker signals.
Shows medium and strong opportunities only.
Balanced for intraday trading.
-
-
Strong Signals (Most Filtered)
-
Only the highest-quality signals.
Best for conservative traders or volatile conditions.
-

2. Timeframe Recommendations
The strategy works with 1-minute charts and higher:
-
1 min: Scalping
5–15 min: Intraday
30 min–1 hour: Swing entries confirmation
Using Heikin Ashi (as shown in the images) can smooth noise and improve visual clarity.
3. Trading Rules
3.1 Buy (Long) Rules
Enter a Buy when all conditions below are met:
-
A green Buy signal appears.
-
The Buy signal forms above or near a green support line created by previous Buy signals.
-
Price shows bullish momentum, such as:
-
Heikin Ashi candle turning green,
Breakout above recent micro-resistance,
Increasing volume.
-
Stop-Loss (SL):
-
Place SL below the green support line, or
Below the last market swing low.
Take-Profit (TP):
Option A: Fixed RR
-
TP = 1.5× or 2× the stop-loss distance
Option B: Structure-based
-
Target next red resistance line created by Sell signals.
3.2 Sell (Short) Rules
Enter a Sell when all conditions below are met:
-
A red Sell signal appears.
-
The Sell signal forms below or near a red resistance line created by previous Sell signals.
-
Price confirms bearish momentum, such as:
-
Heikin Ashi candle turning red,
Breakdown below micro-support,
Rising downside volume.
-
Stop-Loss (SL):
-
Place SL above the red resistance line, or
Above the last swing high.
Take-Profit (TP):
Option A: Fixed RR
-
TP = 1.5× or 2× the stop-loss distance
Option B: Structure-based
-
Target the next green support line created by Buy signals.

4. Signal Mode Selection
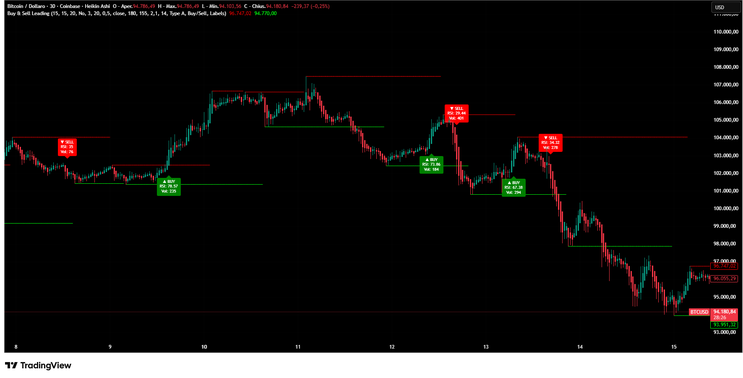
4.1 All Signals Mode (Photo 1)
Use when:
-
Market is trending strongly,
You need many entries (scalping),
You can monitor trades actively.
Best for: Fast scalping on 1m–5m.
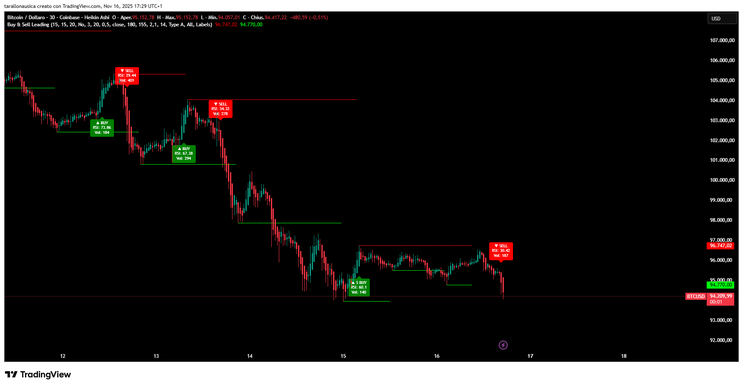
4.2 Buy & Sell Signals Mode (Photo 2)
This mode filters out weaker signals.
Use when:
-
Market is less volatile,
You want fewer false signals,
You prefer medium-term entries.
Best for: Intraday trading on 5m–15m.
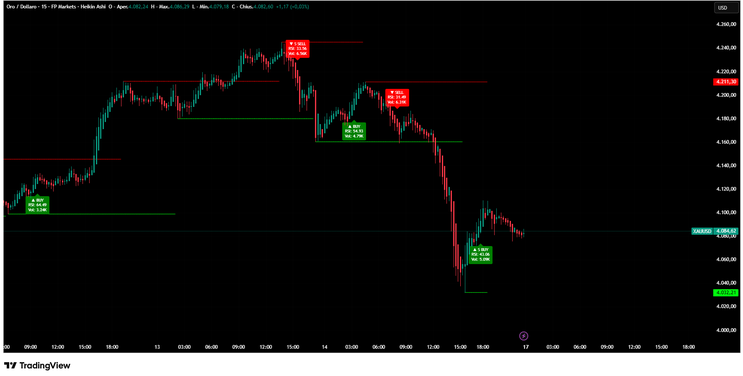
4.3 Strong Signals Mode (Photo 3)
Only the highest-confidence signals appear.
Use when:
-
You prefer safer, cleaner setups,
Volatility is high,
Trading sessions are unpredictable.
Best for: Higher timeframes or conservative traders.
5. Trade Management Rules
5.1 Don't take signals against a strong trend
Confirm trend direction with:
-
Higher highs / higher lows (uptrend)
Lower highs / lower lows (downtrend)
Optional moving averages (e.g., EMA 50/200)
5.2 Avoid trading during low-volume periods
Examples:
-
Late night sessions
Low-liquidity weekend hours (crypto)
5.3 Close the position if the opposite signal appears
This acts as an emergency exit.
6. Example Workflow for Traders
Step 1 — Choose your signal mode
-
Scalper → All
Intraday → Buy & Sell
Conservative → Strong
Step 2 — Wait for a signal
Don't anticipate signals. Wait for confirmation.
Step 3 — Check market structure
Confirm with:
Support/resistance lines
Step 4 — Set Stop-Loss
Place SL outside the support/resistance line generated by the signal.
Step 5 — Manage the trade
Use trailing stops or fixed targets.
7. Strategy Notes
-
Signals are filtered, meaning the indicator already removes many false positives.
The support/resistance lines created by the indicator help identify likely reversal zones.
Using the indicator with Heikin Ashi candles gives smoother entries.
Conclusion
This strategy provides a structured approach to trading Buy/Sell signal indicators on TradingView.
By choosing the appropriate signal mode (All, Buy/Sell, Strong) and following strict entry and risk-management rules, traders can adapt to different market conditions while maintaining discipline
and consistency.
270# RSX Forex Scalping
RSX CFB Adaptive with DPI Trading System
RSX CfB adaptive
Submit by Maximo Trader 20/12/2012
RSX Scalping is a trading system based on RSX and DPI indicator with Two Moving averages.
Time Frame 15 min;
Currency pairs;any
Metarader Indicator:
DPI indicator;
exponential moving averages (EMA 34, EMA 89,);
RSX CfB adaptive, indicator;
Optional for exit add.allpivot. indicator.
Draw two orizzontal lines at 14 and -14 in RSX. This area represent flat zone.
Define the trend:
trend is up qhe EMA 34>EMA 89 and DPI > of the ema's.
TheTrend is flatsi DPIis into ara EMA 34 and EMA 89
Buy
at close of the first bar with DPI > Ema 34 and >EMA89 with RSXaqua but is not in flat area.
Sell
at close of the firs bar with DPI < Ema 34 and <EMA89 with RSX red but is not in flat area.
Exit position:
when RSX changes colour,
exit on the levels all pivots.
Stop loss 3 pips above 34 EMA for sell. below 34 EMA for buy.
This is a scalping strategy preffered to use fast profit target, that depends by currency pairs.
In the pictures RSX Forex Scalpingin action.
RSX Scalping System
144# Advanced RSX Strategy - Forex Strategies - Forex Resources
RSX Metatrader Indicator - Forex Strategies - Forex Resources ...
70# Advanced RSX Scalping Strategy - Forex Strategies - Forex ..
50# Jurik Scalp Net - Forex Strategies - Forex Resources - Forex ...
Jurik Metatrader Indicator - Forex Strategies - Forex Resources ...
141# Jurik STC System - Forex Strategies - Forex Resources -
Cycle Metatrader Indicator - Forex Strategies - Forex Resources ...
Digital Filters Metatrader Indicators - Forex Strategies - Forex ...
T3 Metatrader Indicator - Forex Strategies - Forex Resources - Forex ...
Fx Fisher Metatrader Indicator - Forex Strategies - Forex Resources ...
