


307# Trend and Volume Blast Strategy MT4
Dimitri 2026
This Trend and Volume Blast system is designed to help identify high-probability trades by combining trend direction, volume strength, and multi-timeframe confirmation. Instead of relying on a single signal, it filters the market through multiple indicators so that trades are only taken when several conditions align, reducing false entries and improving overall consistency.
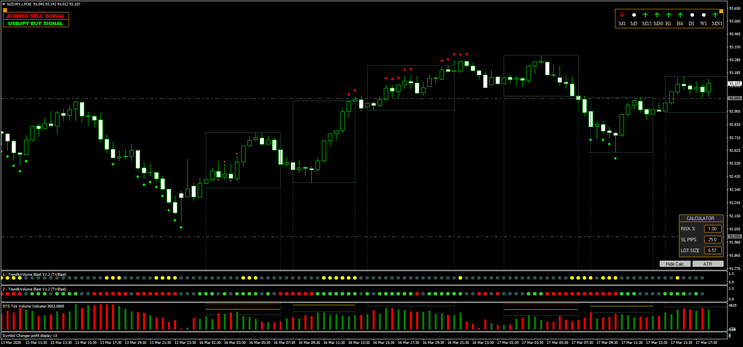
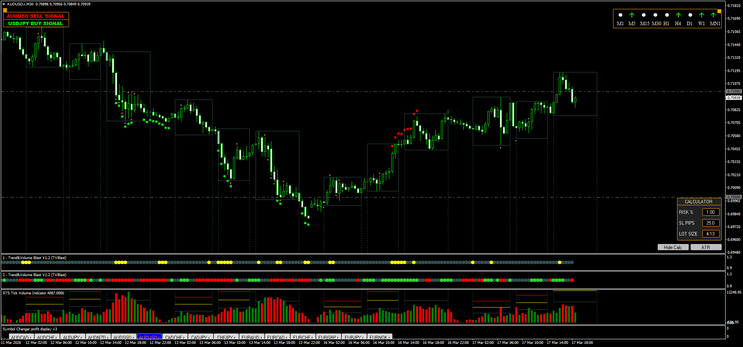
On the main chart, price is displayed using candlesticks, and the red dots plotted above or below the candles act as potential turning points. When dots appear above price, they suggest bearish pressure and possible sell opportunities, while dots below price indicate bullish pressure and possible buy setups. These signals come from reversal and round-number logic, so they highlight areas where the market may react, but they should not be used alone.
The rectangles drawn on the chart represent phases of consolidation or ranging markets. When price is moving inside these boxes, the market is typically indecisive, and trading is riskier. The more important moment is when price breaks out of these zones, as that can signal the start of a new trend or momentum move.
Below the chart, the TrendVolume Blast indicators provide confirmation of market direction. When both indicators are green, it means bullish pressure is strong; when both are red, bearish pressure dominates. If the colors are mixed or unclear, it indicates weak or conflicting conditions, and it is better to avoid trading. These indicators are essential because they combine price action with momentum.
The volume histogram at the bottom adds another layer of confirmation. Green bars represent buying activity, and red bars represent selling activity. Strong trades usually occur when volume increases in the same direction as your trade. For example, a buy setup is stronger when green volume bars are growing, while a sell setup is more reliable when red volume increases.
In the top-right corner, the multi-timeframe panel shows the direction of different timeframes, from very short-term to long-term. This helps you align your trades with the broader market trend. The most important timeframes to watch are the higher ones like H1, H4, and D1. Trading in the same direction as these timeframes significantly increases the probability of success.
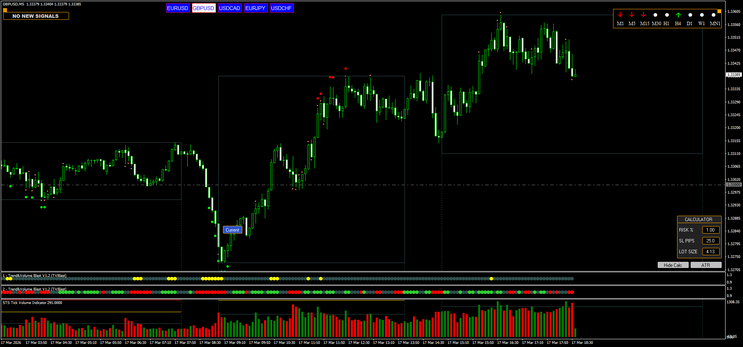
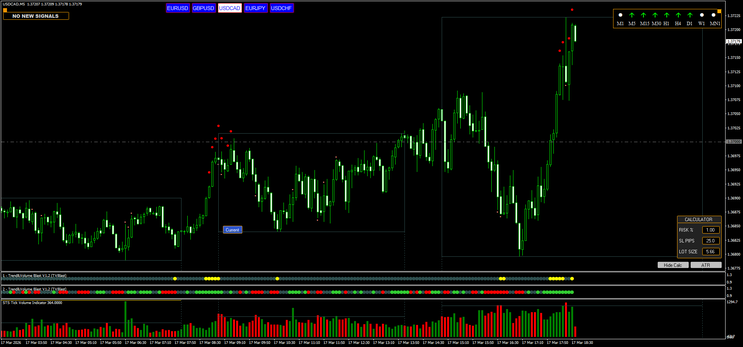
When the system displays “NO NEW SIGNALS,” it means that the required conditions are not aligned. This usually happens during consolidation or when indicators are giving mixed signals, and it is a clear instruction to stay out of the market.
Finally, the risk calculator on the chart helps manage position size based on your chosen risk percentage and stop-loss distance. This ensures consistent risk management, which is a key part of long-term profitability.
In practice, a valid trade occurs when trend direction (TrendVolume), signal dots, volume, and higher timeframe bias all point in the same direction. If even one of these elements is missing or conflicting, the system suggests waiting. This approach makes the strategy more selective, focusing only on clearer and stronger market conditions rather than forcing trades.
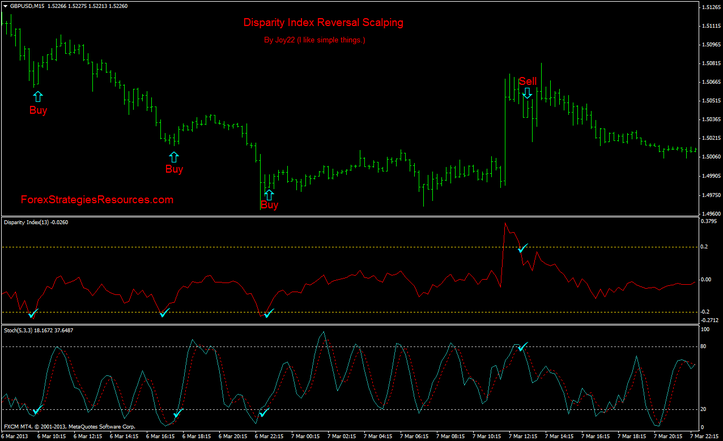
307# Disparity Index Reversal Scalping
Trading with Disparity index indicator and Stochastic indicator
Submit by joy22 23/03/2012
Disparity Index Reversal Scalping is an Forex Strategy based on Disparity index indicator and Stochastic indicator.
What is Disparity Index:” Disparity Index as "a percentage display of the latest close to a chosen moving average. “
Disparity Index Reversal Scalping System setup
Time Frame all.
Currency pairs any.
Setting for Scalping System time Frame 15-30-60 min.
15 min 13 period, levels (0.2; -0.2) GBP/USD.
30min 13 period, levels (0.4;-0.4);
60 min 13 period, levels (0.5;-0.5);
Indicators:
Disparity index indicator;
Stochastic (8,5,3,) indicator.
Long Entry
Disparity Index crosses above its OverSold Level and wait that stochastic cross upward from OverSold Zone.
Long Exit
Disparity Index crosses below its OverBought Level, it's Zero Level, or it's OverSold Level.
Short Entry
Disparity Index crosses below its OverBought Level and wait that stochastic cross downward from Overbought zone.
Short Exit
Disparity Index crosses above its OverSold Level, it's Zero Level, or it's OverBought Level.
disparity index reversal scalping 15 min Template

Disparity Index
Share your opinion, can help everyone to understand the forex strategy.
Reversal Trading System
Bollinger Bands Reversal Trading System - Forex Strategies -
66#Envelope Reversal Trading System - Forex Strategies - Forex
Double Bottom (Reversal Pattern) - Forex Strategies - Forex ...
Trend Wave and Bollinger Bands Scalping system - Forex
Bullish Reversal Candlestick Pattern - Forex Strategies - Forex ...
123# ATR Channels Strategy - Forex Strategies
286# Bollinger Bands MACD Scalping System - Forex Strategies
