


331# Reversal Strategy (RSI + Volatility Zones + Structure) – TradingView
Joy22 2026
Reversal Strategy (RSI + Volatility Zones + Structure) is a mean-reversion reversal system
designed for intraday trading on TradingView.
It combines three key elements:
-
RSI extremes → to detect exhaustion;
-
Bollinger multi-deviation zones (2–4σ) → to locate overextended price;
-
Market structure (BOS / CHoCH) → to confirm reversal context.
The goal is simple:
identify when price is too far from equilibrium, wait for confirmation, and trade the snap-back move with controlled risk.
Setup
Platform TradingView.
Timeframes 15 minutes, 30 minutes, 1 hour.
Markets Forex pairs such as EURUSD, GBPUSD, AUDJPY, USDJPY, plus Gold XAUUSD and indices like US500.
Indicators RSI length 14 with levels 73 for overbought and 31 for oversold. Bollinger Bands based on SMA 20 with deviations 2, 3, and 4. Market structure using CHoCH and BOS for confirmation.
Risk management based on fixed stop loss adapted to the instrument and take profit levels at 1:1, 2:1, and 3:1.
Core concept
Price moves in cycles of expansion, exhaustion, and reversion. When price reaches extreme volatility zones and momentum becomes unsustainable, the probability of a reversal increases. This
strategy focuses on the exhaustion phase and trades the return toward the mean.
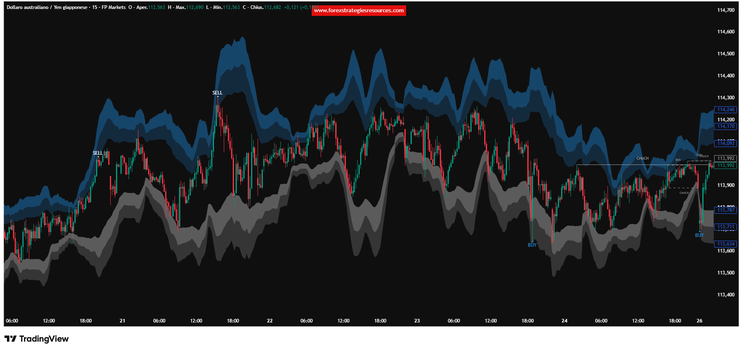
Trading rules
Buy
A buy setup occurs when price reaches the lower Bollinger zone between 2 and 4 deviations and RSI is below 31. The candle must close bullish and the previous candle must be bearish, indicating a
shift in momentum. A stronger setup is confirmed by a CHoCH or the presence of a support area. Entry is taken at the close of the confirmation candle. Stop loss is placed below the recent low or
using the predefined distance from the script logic. Take profit targets are set at 1:1, 2:1, and 3:1 risk reward levels.
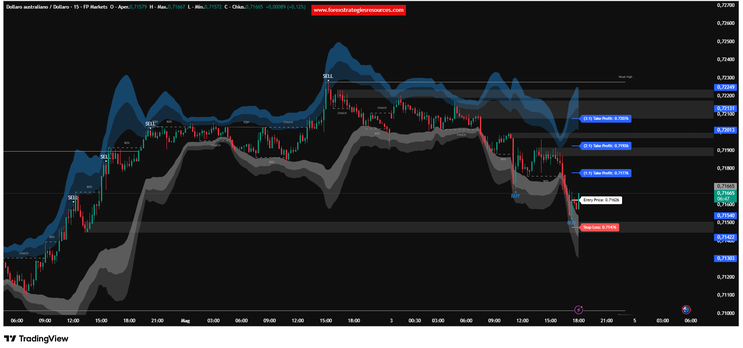
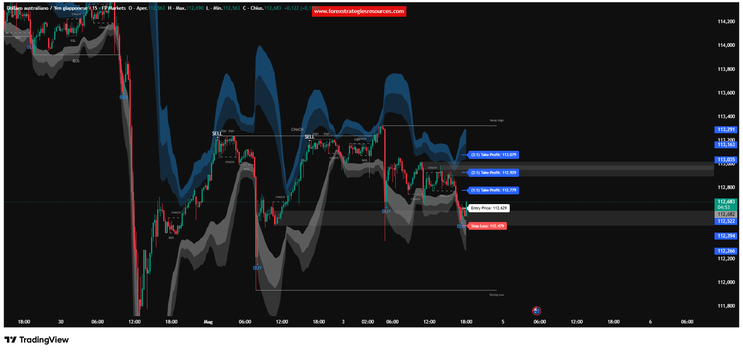
Sell
A sell setup occurs when price reaches the upper Bollinger zone between 2 and 4 deviations and RSI is above 73. The candle must close bearish and the previous candle must be bullish. Additional
confirmation comes from a CHoCH or resistance or weak high. Entry is taken at the close of the confirmation candle. Stop loss is placed above the recent high. Take profit targets are set at 1:1,
2:1, and 3:1.
Trade management
The first target at 1:1 is used to reduce risk. After reaching TP1, stop loss can be moved to break even. The remaining position is managed toward TP2 and TP3. Early exit is considered if an
opposite signal appears or if market structure breaks against the position.
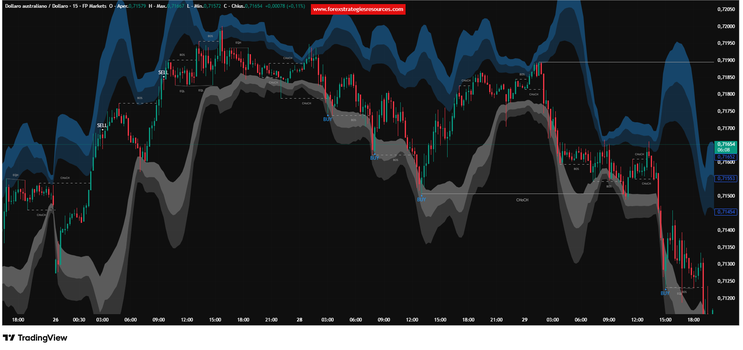
Chart logic
Price extends into extreme Bollinger zones, RSI confirms exhaustion, and structure labels highlight the transition. The entry occurs only after confirmation, avoiding premature entries and
improving trade quality.
Strengths
The strategy works well in ranging and intraday conditions, provides clear and mechanical rules, and includes structured risk management. It filters many false signals by requiring confirmation
before entry.
Weaknesses
It performs less effectively in strong trending markets without pullbacks. RSI alone can generate early signals, so confirmation is essential. Discipline is required to avoid overtrading.
Conclusion
This Reversal Strategy is a structured and disciplined approach to mean reversion trading. It combines volatility, momentum, and structure to identify high probability reversal points. The edge
comes from waiting for confluence and confirmation rather than reacting to every signal.
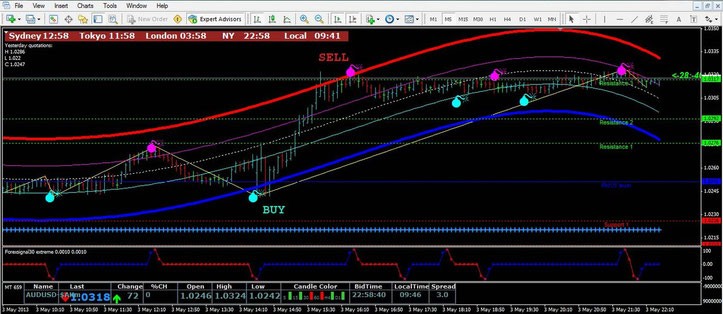
331# Fibonacci Pivot with Center of Gravity Scalping System
I-Regression Trading Method by Ricky Foe
Submit by Ricky Foeh written by Ricky Foeh Kupang Indonesia 05/05/2013
Time Frame 5 min or higher
Currency pair Major
Metatrader Indicator:
XPS V.8 Clock,
Bid View,
Center of Gravity,
Fib Pivot 02,
Fibonacci Pivot,
Forex Signal indicator,
Target Point,
FTI Top Bottom indicator,
FX Lauer indicator,
GP Clock indicator,
ZIG Zag indicator.
HERE I'M SENDING TEMPLATE AND FOREX INDICATOR THAT I USED FOR REST OF 5 YEARS....
I HOPE YOUR ARE SUCCEED IN TRADING FOREX. THIS INDICATOR BETTER USED IN TIME FRAME M5, AND YOU CAN GET MORE THAN 100 PIPS A DAY......
IF YOU HAVE QUESTION PLEASE SEND TO ME +6281236694888
OR EMAIL [email protected]
In the pictures below Fibonacci Pivot with Center of Gravity Scalping System in action.
-
#8
i want this
-
#7
Thank you very much!
-
#6
tank you
-
#5
有効なインジ
-
#4
Anyone understand this strategy to share how to use?
-
#3
Does the indicator repaint?
-
#2
what is the take profit value and what are the best pairs for this system??
thanx -
#1
how to set stop loss value for this system???
I-Regression Trading System
Scalping with I-Regression Trading System -
I-Regression Forex Trading System -
Renko with I-Regression bands -
410# I-Regression Trend Trading System -
Silver Trend with I-regression method Trading ..
New Infinity (with i-regression modified) Forex Trading System ...
Past Regression Deviated Method Trading System - Forex
Mj Regression Channel and FX Sniper Ergodic CCI - Forex
107# Novus Orsa Trading System -
