

362# Scalping Trading 1 minute chart
Buy-Sell Alert V.2 scalping System
Scalping Trading System with TMA normalized
Submit By Joy22 17/07/2013
Scalping is most profitable the the market is volatile. This scalping trading system is based on the TMA normalized but is inspired at 1hr trading system Buy -Sell Alert.
Trade only in trend.
Time Frame 1 minute or higher.
Currency pairs any.
Time Frame 30 minutes, 60 minutes, 240 minutes and daily:
Markets: Forex, Stocks, CFD, Futurex, Gold, Silver and Oil.
Metatrader Indicators:
Support and resistance indiator;
Trend Arrows indicator;
RSI Chart Bars;
TMA Slope 1.5 normalized indicator.
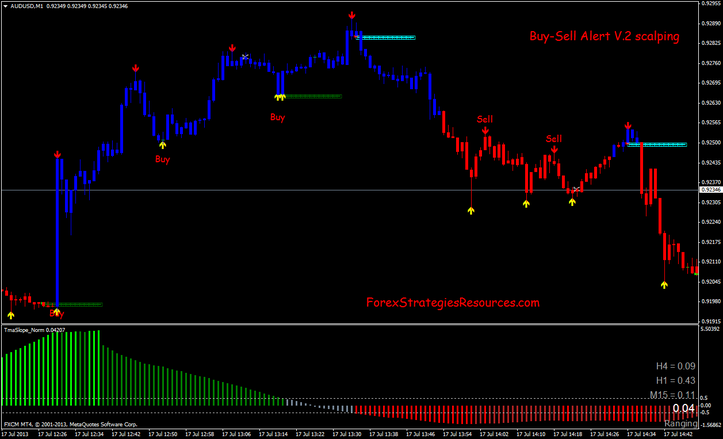
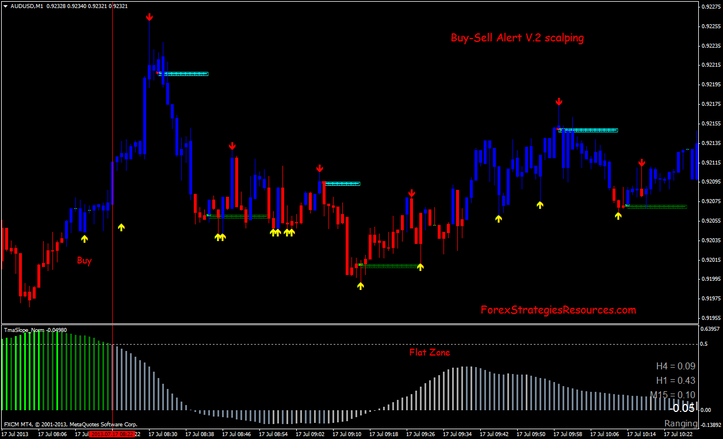
Rules:Buy-Sell Alert V.2 scalping
Long Entry
1)Trend Arrows Buy above support;
2)TMA Spome normalized indicator wit bars green and dark green;
3)Optional RSI Blue bars.
Short Entry
1)Trend Arrows Sell below resistance;
2)TMA Slope normalized indicator with bars red and fire brick;
3) Optional RSI Red Bars.
Exit position
At opposite Arrow or fast Profit Target for Example (EUR/USD 7 pips, AUD/UDS 6 pips, GBP USD 8 pips).
Place initial stop loss 10-15 pips after 5 pips in gain move stop loss at entrty poin.
In the pictures belowBuy-Sell Alert V.2 Scalping System in action.
Buy-Sell alert V.2 Forex Scalping System indicators and template
metatrader indicators
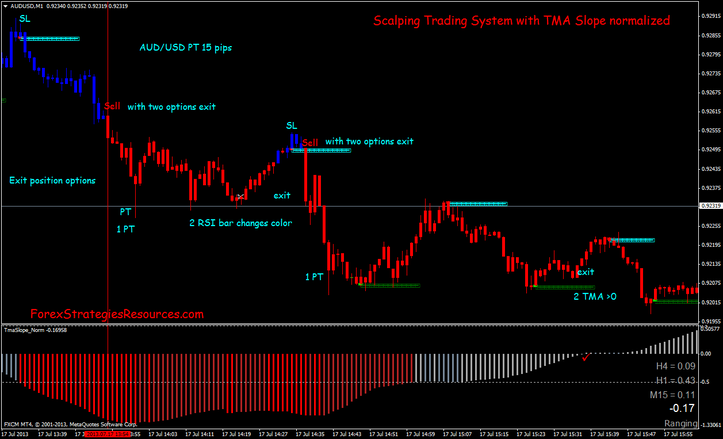
Another interpretation of this trading style:
Scalping Trading System with TMA Slope normalized
RSI chart bar indicator;
Support and resistance indicator;
TMA Slope 1.5 normalized indicator.
Long Entry
RSI Chart Bars Blue color above support and TMA Slome normalized indicator with bars green and dark green.
Short Entry
RSI Chart Bars Red color below resistance and TMA Slope normalized indicator with bars red and fire brick.
Exit position options
1)When RSI Chart Bars changes color or
for Buy when TMA slope normalized is <0
for Sell when TMA slope normalized is >0;
Profit Target 13-20 pips depends by currency pairs.
Place initial stop loss at the previous swing after 12 pips in gain move Stop loss at entry point.
Share your opinion, can help everyone to understand the forex strategy.

John (Tuesday, 04 June 2019 01:40)
Hi.
Nice strategy, was wondering if the buy sell arrows has been updated to have alerts notifications like via email. Would really be awesome if I can be sent this. Email is idreezz@yahoo.com. thanks
Jack (Friday, 11 March 2016 13:17)
TMA slope repaints!!!!
soft (Friday, 19 July 2013 18:32)
Where is RSI Chart bars indicator?