


172# Delta Reaction Zones -Complete Guide -TradingView
Joy22 2026
The Delta Reaction Zones indicator is an advanced order flow tool designed to identify support and resistance areas based on volume imbalance rather than price alone; instead of relying on traditional levels, it analyzes the relationship between buying and selling pressure through delta, allowing traders to see where real market participation has taken place; in practical terms, it highlights zones where institutional activity is more likely to have occurred, making those levels significantly more reliable for trading decisions.
The indicator builds zones using cumulative delta and pivot detection. It evaluates whether buying or selling pressure dominates over a given window, then constructs dynamic zones whose width adapts to volatility through ATR. This results in areas that reflect both liquidity and current market conditions rather than static price levels.
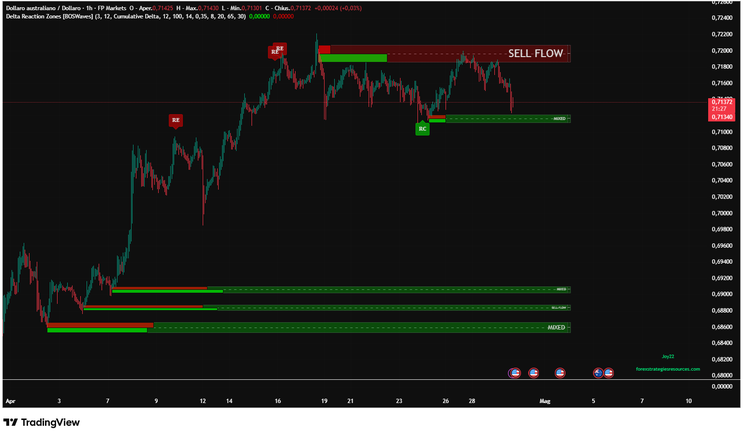
Understanding the labels is essential for using the indicator correctly. Green zones represent support and are generated from lower delta pivots, meaning that buyers were dominant in that area. Red zones represent resistance and are created from upper delta pivots, indicating strong selling activity. These zones are not arbitrary, but are derived from actual imbalances in traded volume.
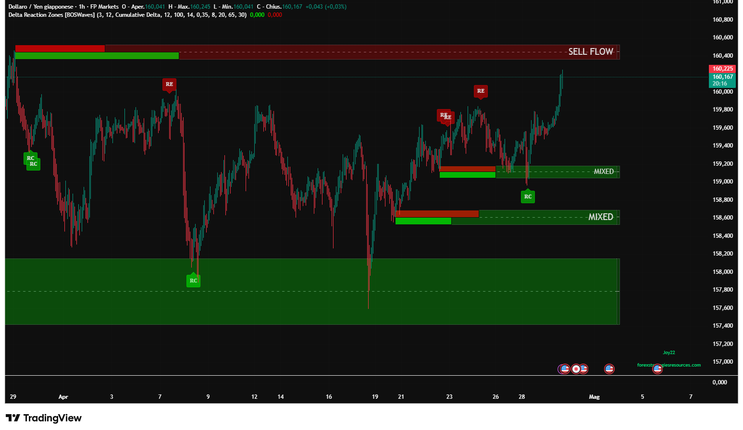
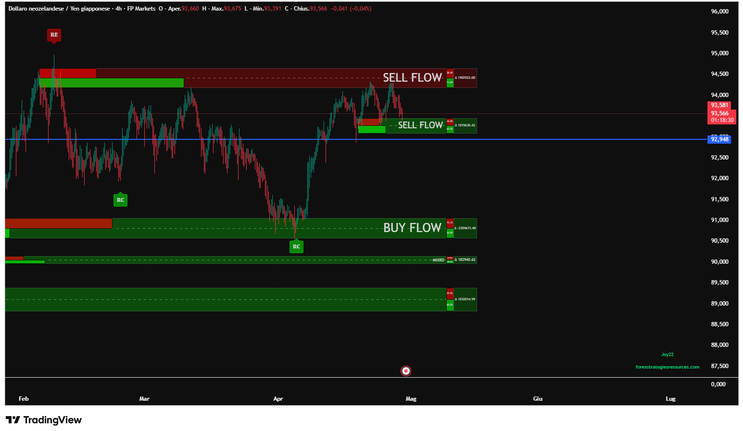
Inside each zone, the indicator displays a flow label that summarizes the dominant side of the market. When selling pressure exceeds sixty percent, the label shows SELL FLOW. When buying pressure exceeds sixty percent, it shows BUY FLOW. Otherwise, the label is MIXED, indicating indecision and lower reliability. This classification comes from the comparison between positive and negative delta accumulated over the impulse window.
On the right side of each zone, percentage boxes display the exact distribution of flow. The upper portion corresponds to selling pressure, while the lower portion corresponds to buying pressure. For example, a zone with seventy percent selling pressure is typically a strong resistance, while a zone with sixty-five percent buying pressure is a strong support. These percentages provide an objective way to evaluate the quality of a level.

The indicator also shows a net delta value expressed as Δ followed by a number. This represents the strength of the impulse that generated the zone. Higher values indicate stronger participation and therefore more significant levels, while lower values suggest weaker and less reliable zones.
Each zone contains a dashed midline, which represents the equilibrium level of the imbalance. This level is particularly important because it acts as a trigger point for continuation or reversal setups. Many of the most effective signals generated by the indicator are based on how price behaves around this midline.
Two main signals can appear on the chart. The first is the support reclaim signal, labeled RC, which occurs when price moves below a support zone and then crosses back above the midline, indicating that buyers have regained control. The second is the resistance re-entry signal, labeled RE, which occurs when price moves above a resistance zone and then falls back below the midline, indicating renewed selling pressure.
From a trading perspective, the indicator can be used in several structured ways. The most straightforward approach is the zone rejection strategy, where the trader waits for price to enter a zone and then looks for a reaction in the direction suggested by the flow. Buying near support zones with dominant buying pressure and selling near resistance zones with dominant selling pressure is the core idea. Stop loss should be placed beyond the zone boundaries, and targets can be set at the next opposing zone or based on a fixed risk-to-reward ratio.
A more advanced and often more powerful approach is the reclaim and re-entry strategy. In this case, the trader does not enter immediately at the zone, but waits for confirmation through a midline cross. A support reclaim signal suggests a long entry after buyers reassert control, while a resistance re-entry signal suggests a short entry after sellers step back in. This method filters out weaker reactions and aligns entries with momentum.
Flow confirmation plays a critical role in both strategies. Zones with a clear dominance above sixty percent are significantly more reliable, while mixed zones should generally be avoided or traded with caution. The combination of strong flow, high delta impulse, and recent formation creates the highest probability setups.
Not all zones should be treated equally. Priority should be given to zones with high net delta values, clear directional flow, and recent creation time. Older zones or those already broken lose significance, as the underlying imbalance has likely been absorbed by the market.
Common mistakes include trading every zone without filtering, ignoring the flow percentages, entering trades in the middle of zones instead of at the edges or on confirmation, and using the indicator without considering overall market structure or trend direction. Like any advanced tool, it requires context and discipline to be effective.
The indicator performs best in liquid markets such as indices and major forex pairs, where volume data is more meaningful and order flow dynamics are clearer. It is particularly effective on instruments like the US500, where institutional participation drives clean reactions. In contrast, it is less reliable in low volume or highly erratic markets.
In conclusion, the Delta Reaction Zones indicator provides a powerful framework for understanding where real buying and selling activity has occurred. By combining zone structure, flow analysis, and midline signals, traders can build a strategy based on actual market participation rather than assumptions. The key is not to predict price movement, but to react to areas where imbalance has already been established, aligning trades with the underlying flow of the market.

17# CCFp Diff v2, Basket Trading System
CCFp Diff v2 FF ES TRADER
ew basket, other +110 pips in less than 1 hr (closed at +110 after taking the picture).
Wich are yours parameters?
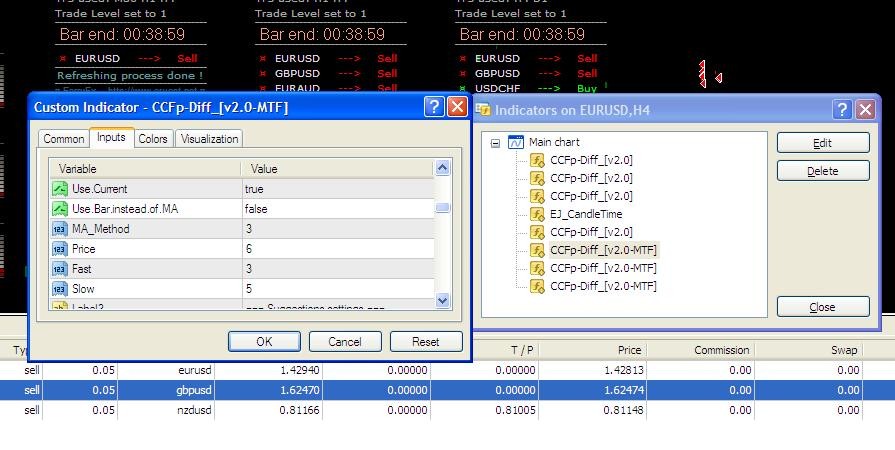
Indicators : CCFpDiffv2.0?
Time frame : 1440?
User Current : True?
User Bar : True?
Trade Level : 3?
Is this correct?
Today's basket based on histo only
GMT +0
Basket was considered between pairs matching from D1 & H4 :
GBP/JPY - BUY
GBP/CHF - BUY
AUD/JPY - BUY
AUD/NZD - BUY
AUD/CHF - BUY
GBP/NZD - BUY
1.Open any chart with 4 hr bar
2.add CCfpIndicator.
3. look for differences of each currency on the data menu of the LAST TWO 4hr bar.
4 Open the postion 5-10 minutes after the new bar has opened
The account has grown pretty good with alsmost no loss so far in the last one month.
Excel
I have put together an automated pair selector in an Exel worksheet. Just enter + or - to the corresponding currency and it will make the right combination of pairs you can trade.
Cocoth is using this setup
%Risk for the basket : 3%
%Risk per pair : 0.5%
Stop Loss : 100 pips
Take Profit : 200 pips
B/E : 30 pips
B/E profit : 4 pips
Trailing stop activate : 30 pips
Trailing stop : 30 pips
Trailing stop step : 1 pip
I have been testing out a simple system almost exclusively looking at price action with fairely good results.This is how it is done:
GMT +0 :
- Check D1 Current & H4 Current
- Trade the matching pairs
GMT +4 & 8 :
- Check H4 (Level 2 only)
- Enter basket only with a min of 4 pairs
%Risk for the basket : 3%
%Risk per pair : 0.5%
Stop Loss : 100 pips
Take Profit : 200 pips
B/E : 30 pips
B/E profit : 4 pips
Trailing stop activate : 30 pips
Trailing stop : 30 pips
Trailing stop step : 1 pip
240 Current
Use Bar instead of MA : False
1440 Current
Use Bar instead of MA : False
10080 Current
Use Bar instead of MA : True
To choose my pairs, I am only using the Histo (not the given list)
Attached Images
In the pictures CCFp Diff v2, Basket forex system in action.
Here's attached the new releases of the CCFp-Diff and CCFp-Diff MTF.
Now both versions have included the option "current" (true/false) instead of having a separate version.
The MTF version have the Alert coded when at least 1 suggestion is there at the new refreshing period (the smallest of the 4 TFs selected in the inputs).
Enjoy.


3000 pips Weekly
This trading system can be used for a single pair, twin pair or multipair. This system is similar at Basket trading.
