

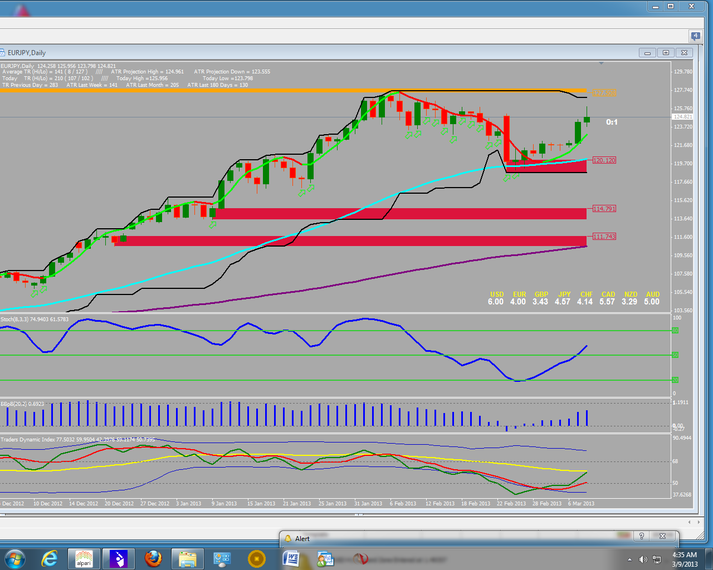
443# 4H and Daily Trading System
ATR Projection indicator trading
Submit by Ketang (Written by Egaalh)01/04/2013
aaa( forced tf 0);
exponential moving average (EMA) (50 close);
ADR Calculator 5 days;
exponential moving average (50 close);
ADR Projection: Style 0 ; Width 3);
Stochastic oscillator (8,3,3, High/low);
TDI (default).
4H and daily trading
-
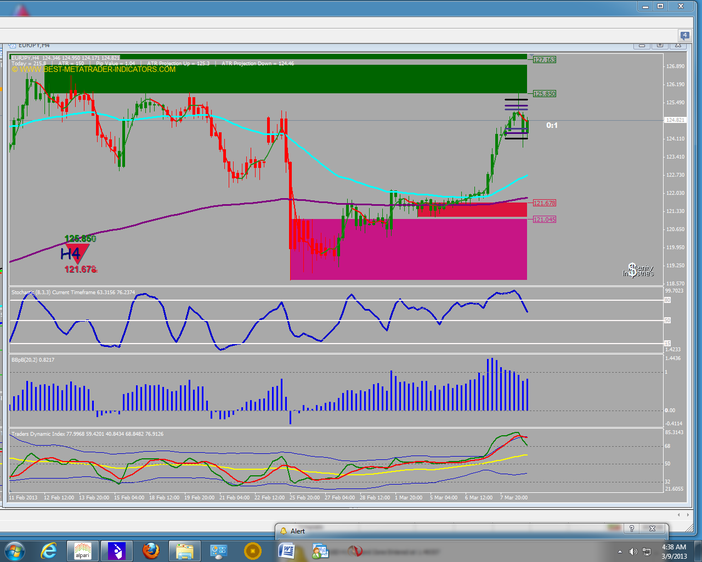
Use 2 charts 4H and daily Time Frame
-
On each chart put a different template for 4H put template _name 2
-
For daily chart put template _name 1
-
Both templates are almost the same but on the 4H you will get the indicator ATR projection
-
Now let’s explain this system..
-
ATR projection is an auto indicator on the chart it will start at 5 p.m EST and will finish at 5 p.m so every day you will get a different ATR. Now all you need is to trade according to ATR most of the time the price will move from bottom to top and opposite on this chart we can see that price went from bottom to top and changed direction until the end of the day. The same price move from top to bottom and opposite. Don’t expect to be correct 100% but this is good enough if you obey the rules.
-
Very important about BBpB indicator (marked E) . You can trade this indicator only under one condition. When you see the line drop below 0 you must wait. if the indicator is below 0 than you don’t get into a long trade .Only after the line speed bar (MARKED J) change color from red to green than you can go long. This indicator BBpb is good only for long not for short. Same with OU indicator on the day chart.
-
The indicator AAA is an auto indicator for s/r you don’t need to touch anything.(marked B)
-
Speed bar and OU signal are very reliable indicators if you will wait until the time will be over, meaning don’t trade before the 4H or day candle is over, before you get in according to those indicators.
-
On the daily chart at the top you can see projection for the day and real high and low .Those numbers are very accurate to watch. Again don’t expect to get 100% but it is very good indicator.(marked A)
-
Look at the strength of all the pairs (MARKED C).and always trade strong against weak.
-
The STOCH (MARKED D)will show you over sold/over bought.
-
If 50 and 200 EMA pointing up then remember you want to trade only long.
-
The bottom indicator is TDI not much to say about this .enough information all over the net.
Post Scriptum When you trade wait for the candle to finish
THE INDICATORS WILL NOT REPAINT IF YOU WILL WAIT FOR THE TIME TO BE OVER.
Many ways to enter or exit the trade .I do it with the speed bar .
Make sure daily chart and 4 hours in the same direction.
In the picture 4H and daily forex system in action.
Share your opinion, can help everyone to understand the forex strategy.

asaens (Wednesday, 07 January 2015 17:49)
warning: I like the speedbars but they use much cpu ... on a weak computer you may experience significant reduction of useability of your MT4 platform. Possible remedy if you experience this problem is to reduce number of bars for computation i.e. from 2000 to 500
asaens (Wednesday, 07 January 2015 16:56)
BBpB seems to be a poor implementation of Bollinger %b ... there are better ones if you search the internet for "Bollinger %b". The right one should work for shorts and longs per description from stockcharts com. Brief description from their site: %B quantifies the relationship between price and Bollinger Bands. Readings above .80 indicate that price is near the upper band. Readings below .20 indicate that price is near the lower band. Surges towards the upper band show strength, but can sometimes be interpreted as overbought. Plunges to the lower band show weakness, but can sometimes be interpreted as oversold. A lot depends on the underlying trend and other indicators. While %B can have some value on its own, it is best when used in conjunction with other indicators or price analysis.
Antoni (Tuesday, 06 August 2013 19:14)
Egaalh, Is there any way that ATR Projection use yesterday data and not changing during a day? (some thing like Pivot points which are fix)
Antoni (Tuesday, 06 August 2013 15:39)
ATR Projection is repaint and it change's high and low levels with changing high and low levels of day...