


14# Learn to trade the VIX and the Volatility Pairs
Keltner Channels and Bollinger Bands Breakout
Sqeeze trading method
Submit by Janus Trader
Keltner Channels and Bollinger Bands Breakout”, is a trading system based on volatility, the purpose of the system is to capture the volatility explosions.. This system is particularly suitable for trading on the Vix Index and volatile currency pairs such as GBP/JPY and the NASDAQ index.
Setup of the Strategy
-
Bollinger Band (20 periods, Deviation 2.0 - aggressive deviation 1.6).
-
Keltner Channels (20, 1)
-
MACD (7, 19, 6).
Trading Rules Keltner Channels and Bollinger Bands Breakout
Buy
Bollinger Bands and Keltner Channels narrow, Bollinger Bands sometimes fall into Keltner Channels.
Candle prices are close above the bands.
MACD crosses upward.
Sell
Bollinger Bands and Keltner Channels narrow, Bollinger Bands sometimes fall into Keltner Channels.
Candle prices are close below the bands.
MACD crosses down ward.
Exit position
Place Stop loss 2 pips above or below the middle band of the Bollinger Bands.
Profit Target ratio: 1:1.3 stop loss or fast profit.
Recommendation
Important Note: The best times to enter is when both bands collapse.
This is the Key.
You have to enter only on the clear compressions of the bands that leave no doubts just so you will have an excellent profitability
Exercise: learn to identify the compression moments of the bands on the chart.
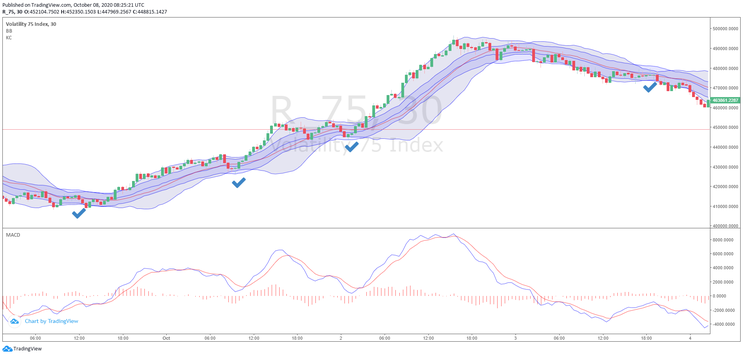
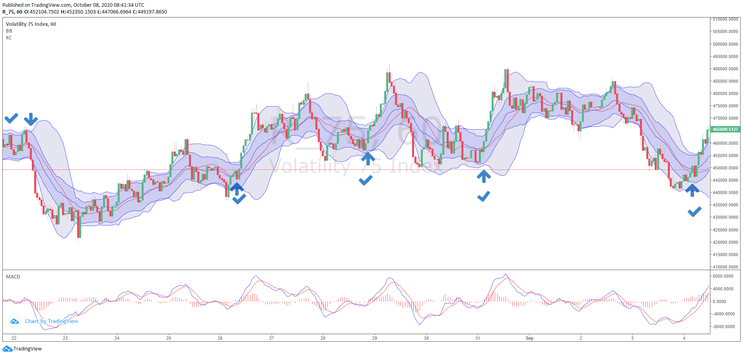
In the following images I show you the compression of the bands on the VIX chart.

In the first daily chart there are 4 clear compressions of the bands followed by explosions of volatility.
Also in the second 15 min time frame graph there are 4 compressions of the bands followed by explosions of volatility.
In image 3 we have 5 compressions with following bursts of price volatility but it is also noted that not all band price breakouts result from a previous compression of the bars. For this reason, we must not confuse the two and we must practice to identify well the compressions of the bands on the chart
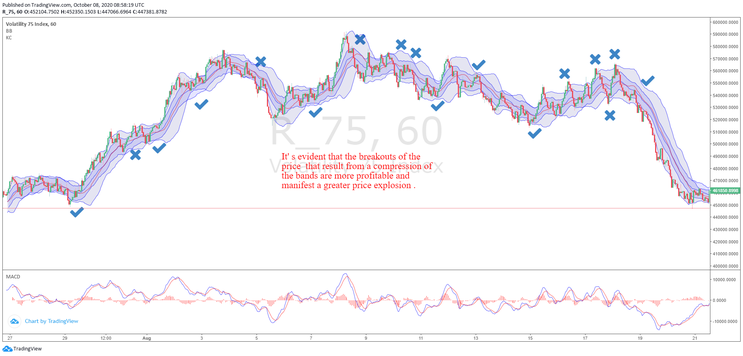
The image above is important because I have highlighted both the breakouts that result from the compression of the bands and the breakouts that do not follow a compression of the bands.It is evident that the breakouts that result from a compression of the bands are more profitable and manifest a greater price explosion .
Telegram Channel: https://t.me/freeforexresources
Share your opinion

greenpips (Friday, 09 October 2020 16:45)
you say : Candle prices are close above the bands (buy) . and Candle prices are close below the bands (sell)
you mean : above the UPPER bands for long ? and below the LOWER bands for short ?
I think so but I would like a confirmation , thanks.