41# Breakout Targets Indicator - TradingView
Dimitri 2026
In modern technical analysis, one of the most widely used trading concepts is the breakout strategy. Markets often spend time consolidating within a range before making a strong directional move. Identifying these consolidation phases and trading the breakout can offer high-probability opportunities, but doing it manually requires time, discipline, and precise risk management.
The Breakout Targets indicator by AlgoAlpha on TradingView aims to simplify this process by automatically detecting consolidation zones and calculating potential breakout targets. The tool is designed for traders who want a structured and visual approach to breakout trading, including predefined entry levels, stop losses, and profit targets.
Overview of the Indicator
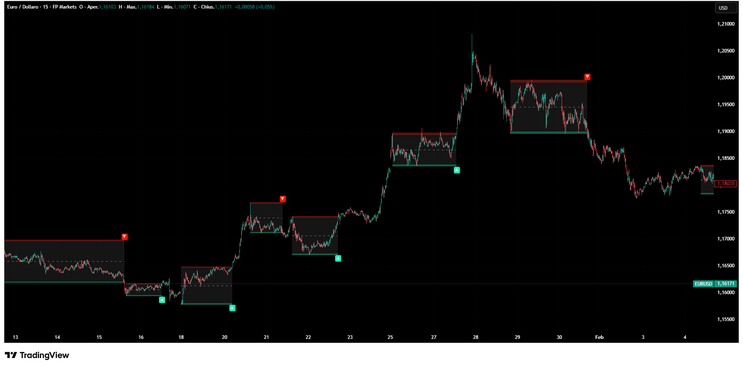
Breakout Targets is a range detection and breakout projection indicator that helps traders identify when the market is compressing and prepares trade levels for when the price eventually breaks out.
Instead of manually drawing support and resistance zones, the indicator automatically detects consolidation structures and displays them as a box or channel on the chart. When the price escapes this range, the indicator generates a breakout signal and calculates potential trade targets.
This approach is particularly useful for traders who focus on:
-
breakout strategies,
volatility expansion setups,
structured risk-to-reward trading models.
The indicator can be applied to multiple markets including cryptocurrency, forex, stocks, and indices, and it works across different timeframes.
How the Indicator Works
The algorithm behind Breakout Targets focuses on identifying periods of reduced volatility, which are often followed by large price movements.
1. Detection of Consolidation Ranges
The first step of the indicator is identifying when the market is moving sideways.
The script analyzes price action using a combination of moving averages and pivot structures to detect when volatility decreases and price begins forming a horizontal range. When this occurs, the indicator draws a consolidation box on the chart.
This box represents an area where buyers and sellers are in temporary equilibrium, meaning neither side has enough strength to push the market strongly in one direction.
These zones are important because they often act as accumulation or distribution phases before a breakout.
2. Breakout Identification
Once the range has been established, the indicator monitors the upper and lower boundaries of the consolidation box.
A breakout occurs when the price closes outside the defined range.
The indicator typically signals:
-
Bullish breakout when price closes above the upper boundary,
-
Bearish breakout when price closes below the lower boundary.
When this happens, the indicator highlights the breakout and activates its trade projection system.
This helps traders quickly recognize when a potential momentum move is starting.
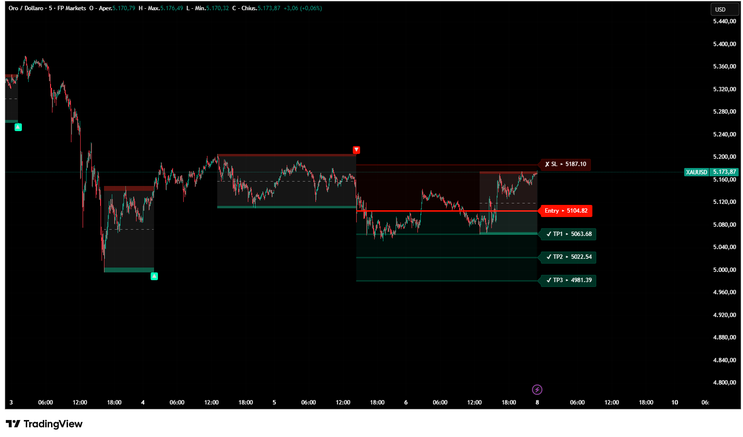
3. Automatic Entry, Stop Loss, and Targets
One of the most useful features of the indicator is its automatic trade management levels.
After a breakout signal appears, the indicator plots:
-
a potential entry level,
a stop loss,
multiple take-profit targets.
The stop loss is calculated using ATR (Average True Range), which adjusts the risk level based on current market volatility. This dynamic calculation helps prevent stops from being too tight during volatile conditions or too wide during calm markets.
The indicator usually provides three take-profit levels, allowing traders to scale out of a position gradually while maintaining a consistent risk-to-reward structure.
This system helps traders follow a disciplined trade plan without needing to manually calculate levels.
Key Features
Some of the main features of Breakout Targets include:
-
Automatic consolidation detection,
Visual range boxes for support and resistance zones,
Real-time breakout signals,
ATR-based stop loss calculation,
Multiple take-profit targets,
Customizable settings for sensitivity and volatility.
These features make the indicator particularly appealing for traders who prefer clear visual guidance and predefined trade structures.
Best Use Cases
Breakout Targets tends to work best in markets that frequently experience volatility cycles, where periods of consolidation are followed by strong directional moves.
It is especially useful for:
-
intraday traders looking for range breakouts,
swing traders trading continuation patterns,
crypto traders monitoring consolidation phases before large moves.
However, like most breakout systems, it can generate false signals in highly choppy or low-liquidity markets. For this reason, many traders combine it with additional confirmation tools such as:
-
trend indicators,
volume analysis,
higher-timeframe support and resistance levels.
Advantages
One of the biggest strengths of the indicator is that it automates several parts of the trading process. Instead of manually identifying ranges and calculating targets, traders can rely on the algorithm to present potential setups quickly.
The clear visual layout also makes it easier to interpret market structure, which is particularly helpful for less experienced traders.
Another advantage is the ATR-based risk management, which adapts to different market conditions.
Limitations
Despite its usefulness, Breakout Targets should not be used as a standalone trading system.
Breakout strategies are inherently vulnerable to fake breakouts, especially during sideways market conditions or near major support and resistance levels. Traders should therefore treat the signals as trade ideas rather than guaranteed entries.
Adding confirmation from other forms of analysis can significantly improve reliability.
Final Verdict
Overall, Breakout Targets by AlgoAlpha is a well-designed TradingView indicator that simplifies breakout trading by combining range detection, signal generation, and risk management into a single tool.
It is particularly valuable for traders who want a structured and visual approach to identifying consolidation zones and preparing breakout trades.
While it cannot eliminate the risks associated with breakout trading, it provides a solid framework that can enhance decision-making and improve trading discipline when used alongside a broader trading strategy.
41# Range Breakout Trading System
Submit by Janus Trader 22/06/2012
Time Frame 15min;
Currency pairs:any;
Indicators:
Fractals
Fractals support and resistance
IB+OB
anti-GUBreakout
Xi- breakout
Bn levels
MA Envelope 50
Long Entry:
The candle of the price, breaks and closes above goldenroad line.
The price is > Xi dashboard line aqua.
Short Entry
The candleof the price, breaks and closes below up goldenroad line.
The price is <Xi dashboard line aqua.
Stop loss on the 50 ma red.
Profit Target 40-60 pips depends by currency pairs:
EUR/USD 50
USD/CHF 40
USD/CAD 40
GBP/USD 60
GBP/JPY 60
EUR/JPY 55
Optional, after 30 pips in gain, move stop loss at entry price.
Note: only one trade, for side for day.