


341# TMA Non-Repaint Indicators: Complete Tutorial
TMA Non-Repaint Indicators: TMA Filtered and TMA Asymmetric
Joy22 2026
Among the many variations of the Triangular Moving Average channel family, two experimental but highly interesting non-repaint implementations stand out for discretionary and semi-systematic trading: TMA Filtered and TMA Asymmetric.
Both attempt to solve one of the oldest problems of classical centered TMA channels: repainting and signal instability. Traditional centered TMAs are visually attractive because they smooth price beautifully, but they recalculate historical values continuously. This creates unrealistic historical precision and misleading entries.
These two versions approach the problem differently. One uses volatility filtering to reduce bad entries; the other redesigns the statistical structure of the channel itself through asymmetric deviation modeling.
TMA Filtered
TMA Filtered is an experimental non-repaint channel designed to combine two independent concepts:
-
a non-repaint TMA channel;
-
a volatility-based directional filter.
The idea behind the indicator is simple but clever.
Classical TMA channels perform well in ranging or oscillating conditions, but they struggle badly during sharp directional trends. In strong momentum environments, price can keep riding the outer bands while reversal traders get trapped repeatedly.
TMA Filtered attempts to reduce this problem by integrating a volatility engine directly into the entry logic.
Instead of treating volatility as a separate confirmation tool, the indicator synchronizes:
-
TMA structure;
-
volatility expansion/contraction;
-
multi-timeframe filtering.
This creates a dynamic filtering mechanism capable of suppressing many weak countertrend entries.
A particularly interesting feature is that the user can select different timeframes independently for:
-
the TMA calculation;
-
the volatility filter.
This gives the indicator unusual flexibility.
For example:
-
a trader may use an H1 TMA channel;
-
while volatility confirmation comes from M15;
-
or vice versa.
This multi-layer structure allows traders to adapt the indicator to different market conditions without changing the core logic.
In ranging markets, the TMA component dominates.
In explosive markets, the volatility filter becomes more selective.
The result is a smoother and more adaptive channel behavior.
Unlike many centered TMA implementations, this version explicitly does not repaint, which is extremely important for real-world trading and strategy testing.
Because signals remain fixed after candle close, traders can evaluate historical entries realistically without illusionary hindsight optimization.
The indicator is still considered experimental because the effectiveness of the filtering depends heavily on:
-
timeframe combinations;
-
volatility parameters;
-
market regime;
-
asset class.
This makes optimization and forward testing essential.
One of the most interesting aspects of TMA Filtered is that trend conditions traditionally considered “bad” for TMA channels can become useful filters instead.
In other words:
-
sharp volatility expansion may invalidate reversal entries;
-
while simultaneously confirming momentum continuation.
This dual interpretation of volatility creates a hybrid logic between mean reversion and trend following.
The indicator therefore behaves less like a classic static envelope and more like an adaptive market-state filter.
TMA Asymmetric
TMA Asymmetric is a much more sophisticated reinterpretation of the classic TMA channel concept.
Instead of using symmetrical volatility calculations around the centerline, it separates bullish and bearish deviations independently.
This seemingly small modification radically changes channel behavior.
The indicator calculates a non-repaint TMA baseline using a weighted triangular averaging structure.
The centerline itself is constructed through progressive weighted smoothing:
TMAi=∑j=0nwj⋅Pricei+j∑wjTMA_i = \frac{\sum_{j=0}^{n} w_j \cdot Price_{i+j}}{\sum w_j}TMAi=∑wj∑j=0nwj⋅Pricei+j
where the weights gradually decrease as distance from the current bar increases.
This creates a smooth curve while maintaining non-repaint behavior because the calculation only references completed historical data.
However, the real innovation lies in the channel deviation logic.
Instead of using a standard symmetric standard deviation around the TMA mean, the indicator measures upward and downward volatility separately.
Positive deviations are accumulated into one buffer:
WUi=WUi+1(L−1)+diffi2LWU_i = \frac{WU_{i+1}(L-1)+diff_i^2}{L}WUi=LWUi+1(L−1)+diffi2
Negative deviations are accumulated independently:
WDi=WDi+1(L−1)+diffi2LWD_i = \frac{WD_{i+1}(L-1)+diff_i^2}{L}WDi=LWDi+1(L−1)+diffi2
where:
-
WUWUWU represents bullish volatility accumulation;
-
WDWDWD represents bearish volatility accumulation;
-
diffdiffdiff is the difference between price and the TMA baseline.
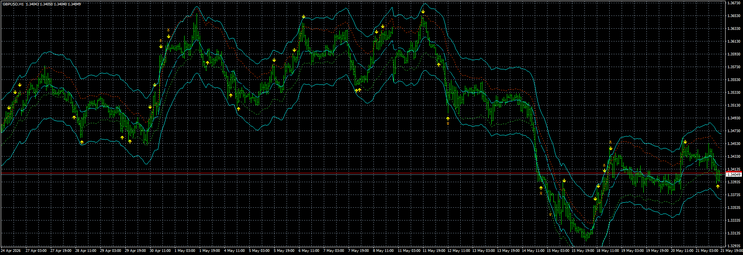
This creates asymmetric upper and lower bands:
Upper=TMA+Deviation⋅WUUpper = TMA + Deviation \cdot \sqrt{WU}Upper=TMA+Deviation⋅WU
Lower=TMA−Deviation⋅WDLower = TMA - Deviation \cdot \sqrt{WD}Lower=TMA−Deviation⋅WD
The effect is extremely important.
Traditional channels assume that bullish and bearish volatility behave similarly.
Real markets rarely do.
Markets often display:
-
aggressive downside volatility;
-
slower upside drift;
-
trend persistence in one direction;
-
asymmetric order flow behavior.
TMA Asymmetric adapts naturally to these conditions.
If bullish pressure dominates, the upper band expands more aggressively.
If bearish pressure dominates, the lower band widens independently.
This produces channels that “breathe” differently on each side of price.
The result is a much more organic representation of market structure.
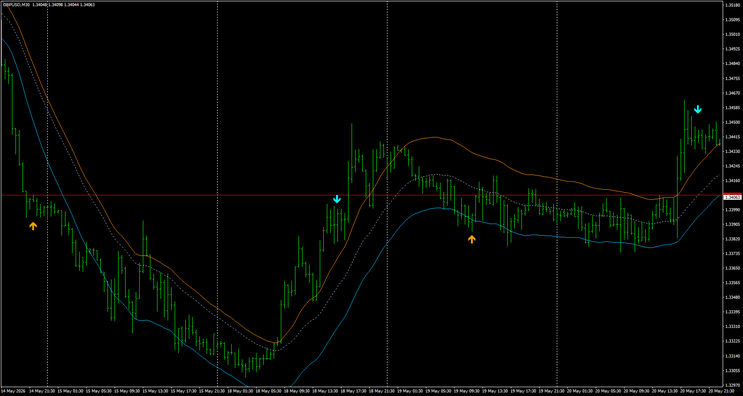
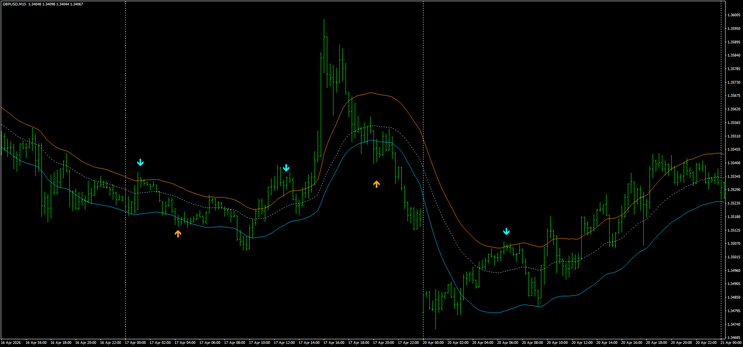
Arrow Logic and Reversal Detection
The indicator also integrates reversal arrows based on band penetrations combined with candle confirmation logic.
Buy arrows appear when:
-
the previous candle pierces below the lower band;
-
the previous candle closes bearish;
-
the current candle closes bullish.
Sell arrows appear when:
-
the previous candle pierces above the upper band;
-
the previous candle closes bullish;
-
the current candle closes bearish.
This creates a simple but effective two-candle exhaustion pattern.
The arrows are additionally offset using ATR distance to improve chart readability and avoid overlap with candles.
Because the entire structure is non-repaint, arrows remain stable after candle close.
This is one of the most important differences versus traditional centered TMA systems.
Multi-Timeframe Structure
Another powerful feature of TMA Asymmetric is its multi-timeframe architecture.
The indicator can calculate channels from higher timeframes while displaying them on lower timeframe charts.
Interpolation logic is used to smooth transitions between higher timeframe values and lower timeframe bars.
This creates a cleaner visual structure and allows traders to combine:
-
higher timeframe directional bias;
-
lower timeframe execution precision.
For example:
-
H4 asymmetric TMA structure;
-
displayed directly on M15 execution charts.
This approach is particularly useful for swing traders and intraday reversal systems.
Final Thoughts
TMA Filtered and TMA Asymmetric represent two very different evolutions of the non-repaint TMA philosophy.
TMA Filtered focuses on filtering poor entries through volatility synchronization and adaptive market-state logic.
TMA Asymmetric focuses on statistical realism by recognizing that bullish and bearish volatility are fundamentally different phenomena.
Both indicators move away from the unrealistic perfection of repainting centered TMAs and toward more practical real-time behavior.
They are not “holy grails.”
Like all advanced channel systems, they require:
-
contextual reading;
-
volatility awareness;
-
trend understanding;
-
proper timeframe alignment.
But for traders interested in adaptive non-repaint channel systems, they are among the more creative and technically interesting TMA implementations available in the MT4 ecosystem.
Practical Ways to Use TMA Filtered and TMA Asymmetric

Non-repaint TMA channels are not meant to predict the future perfectly.
Their real strength is contextual reading of market structure.
The most effective use is usually not “buy every lower band touch” or “sell every upper band touch,” but combining the channel with volatility, trend state, and candle behavior.
Using TMA Filtered
TMA Filtered works best as a hybrid between:
-
mean reversion;
-
volatility filtering;
-
directional confirmation.
The indicator becomes particularly useful because it tries to avoid one of the biggest problems of classic TMA systems: fading strong trends too early.
1. Range Trading and Reversal Entries
The most natural use is identifying exhaustion inside sideways or rotational markets.
Typical setup:
-
price reaches the upper band;
-
volatility filter weakens;
-
momentum slows;
-
bearish candle appears.
Possible SELL setup.
Or the opposite at the lower band.
The volatility filter acts as a protection layer against blindly fading aggressive breakouts.
Without filtering, classical TMA systems often generate repeated losing entries during trends.
2. Volatility Expansion Filter
One of the most interesting ways to use TMA Filtered is not taking reversals during volatility expansion.
Example:
-
price touches upper TMA band;
-
but volatility filter expands aggressively upward;
-
market shows impulsive candles.
Instead of shorting immediately, the trader avoids countertrend entries.
This transforms volatility from an enemy into a directional confirmation tool.
In practice:
-
low volatility near bands → possible reversal zone;
-
expanding volatility near bands → trend continuation risk.
This is extremely useful on:
-
indices;
-
gold;
-
NASDAQ;
-
crypto;
-
news-driven forex sessions.
3. Multi-Timeframe Filtering
A powerful configuration is:
-
higher timeframe TMA;
-
lower timeframe volatility filter.
Example:
-
H1 TMA channel;
-
M15 volatility filter.
The higher timeframe defines structural zones.
The lower timeframe determines whether current momentum supports or rejects the reversal idea.
This reduces random entries significantly.
4. Trend Pullback Entries
Another advanced use is trend continuation instead of reversal.
Example:
-
strong uptrend;
-
price retraces toward lower TMA band;
-
volatility contracts;
-
bullish candle appears.
Instead of fading the channel, the trader uses the lower band as a dynamic pullback zone.
This is often more effective than pure reversal trading.

Using TMA Asymmetric
TMA Asymmetric is less about filtering and more about understanding directional imbalance.
Because upper and lower volatility are calculated independently, the channel itself reveals which side of the market is dominant.
1. Detecting Directional Pressure
One of the best uses is reading asymmetry itself.
Example:
-
upper band expands much faster than lower band;
-
centerline slopes upward;
-
bullish volatility dominates.
This suggests trend persistence rather than neutral ranging behavior.
Conversely:
-
aggressive lower band expansion;
-
widening downside pressure;
-
bearish asymmetry.
This helps traders visually identify when the market is structurally unbalanced.
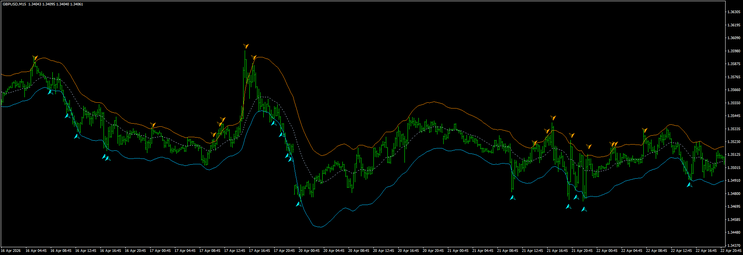
2. Reversal Exhaustion Zones
The arrow logic is designed for exhaustion reversals.
A common setup:
-
candle pierces outer band;
-
candle closes aggressively;
-
next candle rejects the move.
Possible reversal entry.
The logic becomes more powerful because the bands adapt asymmetrically.
In real markets:
-
bearish moves are often sharper;
-
bullish moves often drift more gradually.
The indicator adapts naturally to this behavior.
3. Trend Continuation Bias
Many traders misunderstand TMA systems by treating every band touch as reversal.
With TMA Asymmetric, band expansion itself becomes information.
Example:
-
upper band keeps widening upward;
-
price rides upper band repeatedly;
-
no major lower-band expansion occurs.
This often signals strong bullish continuation rather than overbought conditions.
The same applies inversely in bearish trends.
4. Higher Timeframe Bias + Lower Timeframe Execution
One very practical approach:
-
H4 asymmetric TMA defines directional structure;
-
M15 used for entries.
Example:
-
H4 channel strongly bullish;
-
M15 price retraces into lower band;
-
bullish rejection candle forms.
Possible long continuation entry aligned with higher timeframe asymmetry.
This is often much more stable than trading standalone lower timeframe signals.
Combining Both Indicators
An interesting advanced workflow is combining both concepts:
-
TMA Asymmetric for structural bias;
-
TMA Filtered for entry timing.
For example:
-
TMA Asymmetric shows bullish directional expansion;
-
trader only looks for BUY opportunities;
-
TMA Filtered waits for volatility contraction and pullback stabilization;
-
entry occurs near lower channel zone.
This creates a framework combining:
-
structure;
-
volatility;
-
asymmetry;
-
timing.
Markets Where They Tend to Work Best
These indicators often perform better in markets with:
-
cyclical movement;
-
volatility rotation;
-
institutional mean reversion behavior.
Examples:
-
NASDAQ Composite
-
S&P 500
-
Bitcoin
-
Ethereum
-
major forex pairs during active sessions.
They tend to struggle more during:
-
extreme breakout phases;
-
macro news explosions;
-
one-directional panic trends.
This is why volatility interpretation is essential.
Final Perspective
The real value of these indicators is not generating magical signals.
It is helping traders visualize:
-
volatility structure;
-
directional imbalance;
-
exhaustion;
-
trend persistence;
-
pullback quality.
Used correctly, they become market structure tools rather than simple buy/sell generators.
341# Torgo modified with QQE Alert Trading System
Submit by Janus Trader 23/05/2012
Time Frame H1
Currency pairs:any
Indicators:
Torgo1
Torgo2
Torgo3
SSL fast
Heken Ashi Kuskus.3
QQE alert
Long Entry
QQE Arrow buy confirmed by Torgo 1 and 3 Blue
Short Entry
QQE Arrow sell confirmed by Torgo 1 and 3 Red
Exit position at the QQE opposite alert or with predetermined profit target.(20-40 pips)
Stop loss at previous swing.
Torgo trading system
-
#2
Hey..thanks for sharing this,looks awesome. The only problem is that the QQE arrow alerts aren't appearing. I successfully loaded all the indicators and the templates but i can't see any arrows..Need some help on that kindly..
-
#1
Hey..thanks for sharing this,looks awesome. The only problem is that the QQE arrow alerts aren't appearing. I successfully loaded all the indicators and the templates but i can't see any arrows..Need some help on that kindly..
