


343# Liquidity‑Driven Trend Strategy for MT5: How to Trade Using Heat Map Zones and ADX Momentum
Emiliano Quantitative Trader 2026
A liquidity‑based approach to trading has become one of the most reliable ways to understand where price is likely to move and where it is likely to reverse. In this guide, we explore a complete trading strategy for MetaTrader 5 that combines a Dynamic Liquidity Heat Map Profile with ADX Trend confirmation. This method is designed for traders who want a structured, repeatable system that filters noise and focuses on high‑probability setups. It works on the M5 timeframe and above and can be applied to any major or minor currency pair.
The core idea behind this strategy is simple. The Heat Map reveals where liquidity is concentrated, showing the price levels that attract institutional activity. The ADX Trend with Arrow indicator confirms when momentum aligns with the expected direction. When these two elements converge, the result is a clean, disciplined entry with a logical stop and a clear target.

Understanding the Liquidity Context
Before entering a trade, the first step is to analyze the liquidity landscape. The Heat Map highlights high‑volume nodes, clusters, previous highs and lows, and rejection zones. These areas represent the points where price is most likely to react. If price is trading above a major liquidity cluster, the market tends to maintain a bullish bias. If it is trading below, the bias shifts bearish. When price is trapped inside a dense liquidity block, it is better to wait for a breakout before considering any entry.
This structural reading of the chart prevents premature trades and helps the trader understand the true intention of the market.
Long Setup: Trading Liquidity Sweeps with Momentum Confirmation
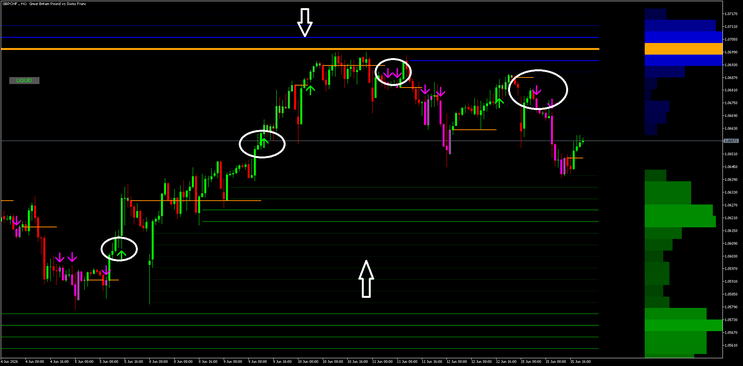
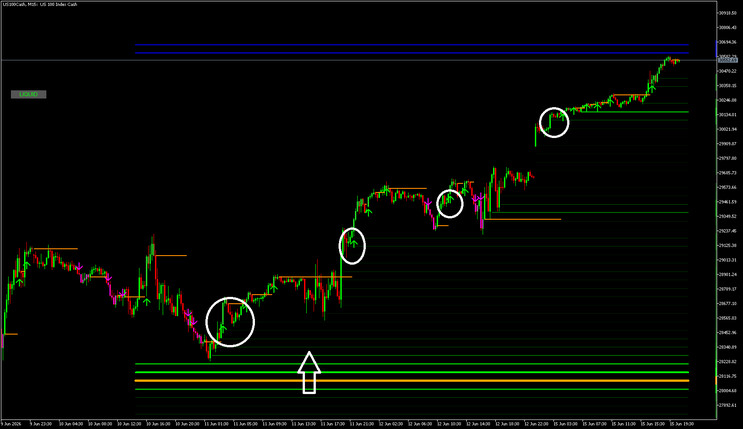
A long position becomes valid when price interacts with a liquidity zone such as a previous low, a heat cluster, or a low‑volume rejection area. After this interaction, the market must show a bullish reaction candle, indicating that liquidity has been absorbed and buyers are stepping in. At this point, the ADX Trend with Arrow must print a green arrow, confirming that upward momentum is building. The final condition is a close above the nearest micro‑liquidity block on the Heat Map. This confirms that price is ready to move away from the liquidity zone and into a new expansion.
For additional confirmation, some traders prefer to see the ADX main line above 20, which signals a strengthening trend.
Short Setup: Using Liquidity Reversals to Capture Downward Moves
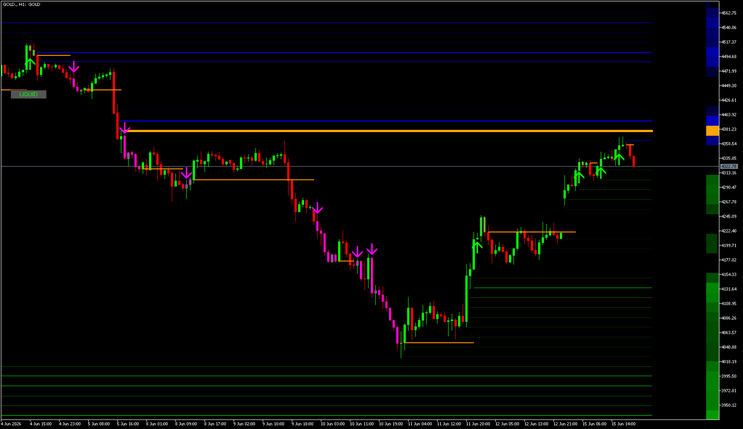
A short position follows the same logic but in the opposite direction. Price must tap or sweep a liquidity zone such as a previous high or a high‑volume node. A bearish reaction candle must form, showing that sellers are defending the level. The ADX Trend with Arrow must print a magenta arrow, confirming bearish momentum. Finally, price must close below the nearest micro‑liquidity block on the Heat Map. This sequence ensures that the trade is aligned with both liquidity and momentum.
As with long setups, an ADX reading above 20 can be used as an optional filter.
Stop Loss Placement and Risk Management
Stop loss placement is straightforward and logical. For long trades, the stop is positioned below the liquidity zone that triggered the entry. For short trades, it is placed above the swept high or liquidity block. This ensures that the stop is protected by the very structure that justified the trade.
Take profit levels can be managed in several ways. A conservative target is the next liquidity cluster or a fixed 1R. More ambitious targets include the opposite side of the Heat Map profile or a 2R to 3R objective depending on volatility. Traders who prefer to run a portion of the position can trail the stop behind new liquidity blocks or exit when the ADX prints an opposite arrow.
Managing the Trade During the Move
Once the trade moves approximately 0.8R in profit, the stop can be moved to breakeven to eliminate risk. If the ADX prints an opposite arrow, it is often a sign that momentum is fading, and reducing or closing the position becomes a prudent choice. It is also important to avoid trading when price is stuck inside a thick liquidity zone, as this typically leads to choppy, directionless movement.
Final Thoughts
This liquidity‑driven trend strategy for MT5 offers a disciplined and structured way to trade the market. By combining the Dynamic Liquidity Heat Map Profile with ADX Trend confirmation, traders gain a clear view of where price is likely to react and when momentum is strong enough to justify an entry. The method is clean, logical, and adaptable to multiple markets and timeframes. It avoids randomness and focuses on precision, making it suitable for both discretionary and semi‑automated trading approaches.


343# Forex Gann Strategy
Submit by Nico (indicators by Xard777) 26/05/2012
This Trading system inspired by Gann thery was made using forex indicators developed by Xard777. This Trend Strategy is trend following.
These indicators are: Simple Bars, Simple bars mataf, Pivot buy-Sell, obo trend bars, fibocal v.31, adaptive Gann High-Low activator Jma heken Ashi arrow histo, XPS V.8 Gann SSL 4HR, MT4 oscillator, Linear Regression buffer, rdb xmeter color, Mt4 candles. see pictures.
-
#3
5 minutes
-
#2
What timeframe to use daily or lower?
-
#1
Pleae advise the best times frames to test this strategy on
17# Collection Trading Systems created by XARD777 -
25# Murrey Math Harmonic Octave -
Touchline - Forex Strategies -
17# Gann HILO System - Forex Strategies - Forex Resources -
67# Absolute Strength With Pama Gann grid - Forex Strategies ...
68# MTF Gann Activator and Neuro Strength - Forex Strategies ...
140# Master Probability with Gann HILO MTF - Forex Strategies ...
69# Gann Hilo Activator, CCI and MACD - Forex Strategies - Forex
Gann Metatrader Indicator - Forex Strategies - Forex Resources ...
208# Gann, CCI and MACD - Forex Strategies - Forex Resources ...
299# Gann HILO DMI - Forex Strategies - Forex Resources - Forex
Forex books about Elliott Wawe, Fibonacci and Gann - Forex ...
343# Forex Gann Strategy - Forex Strategies - Forex Resources ...
139# Alpha Trader - Forex Strategies - Forex Resources - Forex ...
