

77# Two EMA Channel Trading System
Submit by JanusTrader
Time Frame any
We use four moving averages:
- A 60-period Simple Moving Average of the HIGHS
- A 60-period Simple Moving Average of the LOWS
- A 240-period Simple Moving Average of the HIGHS
- A 240-period Simple Moving Average of the LOWS

So you’ve seen the chart above we setup – that’s all this system requires in terms of indicators and tools – the rest is up to us!
The first thing to note is that we trade with the current trend. We use the MAs (moving averages) to help us with that.
If the red MAs (60) are above the blue MAs (240) – then we only look to take long positions.
If the red MAs are below the blue MAs – then we only look to take short positions.
Now, it’s not quite as clear-cut as that, so we have to add a couple of extra rules to this:
#1 – All four MAs should be angled in the same direction as thetrade direction. In other words, if the red MAs are above the blue MAs, the angles of all the MAs should be upwards – like this:
The above rule is the same for short trades – when the red MAs are below the blue MAs, we also was them all to be angled downwards too!
#2 – It is fine for the red MAs to ”overlap” the blue MAs – in other words, only one red MA needs to be above both the blue MAs for a long trade (or only one red MA needs to be below both blue MAs for a short trade).
In fact, it’s better to look at the two red MAs together as a single “tunnel”; and look at both the blue MAs together as a single “tunnel”.Here’s an example of what I mean:
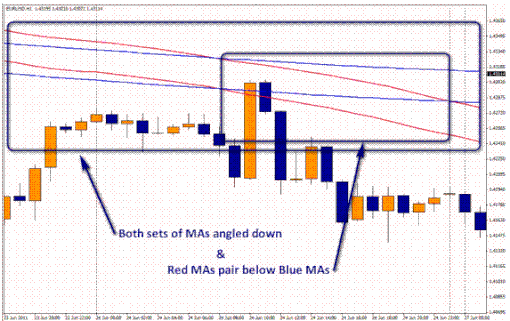
So you can see in the chart that in the inner-box the pair of red MAs are below the pair of blue MAs (well, they are overlapping a little, but you can see what I mean, right?).
Okay, so now you know the direction in which we trade and when. We
take long entries when the red MA pairs are above the blue MA pairs (and vice-versa for short entries).
Entry…
Okay, so we’re about a third of the way there (I told you it would be easy! ) – now the specific entry.
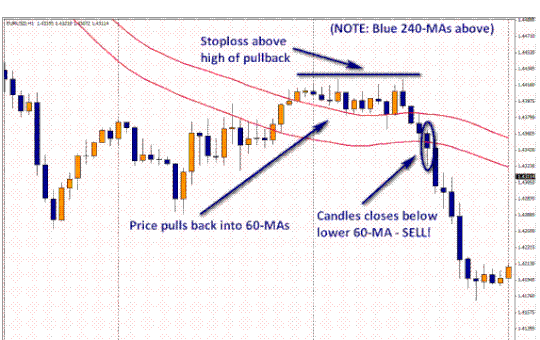
So, assuming we have the 60 (red) MAs above the 240 (blue) MAs, we’re looking for long entries.
We get a long entry when price crosses back down into the 60 MAs (the two red ones) and the first candle closes above the UPPER 60 MA. Here’s an example:

You can also see in the chart where we place our stoploss – it’s always below the low of the pullback for a long (or above the high of the pullback for a short). Let’s take a look at a short entry example:
Exits…
I don’t put a huge amount of emphasis on the exits.
Why? Simply because as long as I stick to the same exit method (whichever it is) – I get consistent returns and I don’t worry about missing profits or start going down the “if only…” path.
Here’s what I do and I find it is a nice balance for me (it’s not anything special – but it works!):
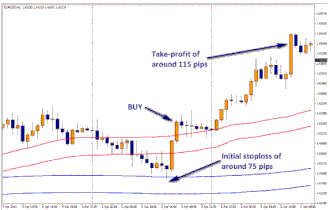
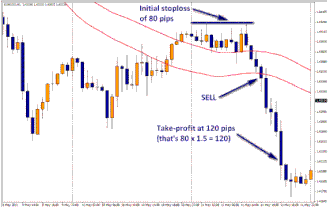
I just take profit at 1.5:1.
In other words I take profit at 1.5 times the initial number of pips I risked.
So for example, if I risked 100 pips initially on a trade – I’d take profit at 150 pips.
Now if the market continues on and reaches 300 pips or more, that’s fine, we have to just accept that – it’s the way of trading.
Just stick to the same take-profit and it will work out!
Using our previous trade examples for the entries we’ll look at them again in terms of take-profit.
The long example from earlier:
Share your opinion, can help everyone to understand the forex strategy.
37# Donchian Breakout - Forex Strategies - Forex Resources ...
Channel Metatrader Indicator - Forex Strategies - Forex Resources ...
Damiani Metatrader Indicator - Forex Strategies - Forex Resources ...
33# Commodity Channel Index Average System - Forex Strategies ...
77# Two MA Channel - Forex Strategies - Forex Resources - Forex
6# ATR Channel Breakout - Forex Strategies - Forex Resources ...
11# Keltner Channels and EMA - Forex Strategies - Forex ...
111# Mj Regression Channel and FX Sniper Ergodic CCI - Forex ...
25# Channel Strategy - Forex Strategies - Forex Resources - Forex
123# ATR Channels Strategy - Forex Strategies - Forex Resources
73# Price Action Channel, “The Gold line” - Forex Strategies - Forex ...
153# Dynamic Channel, Contrarian Strategy. - Forex Strategies ...
5# Channel Breakout and Moving Average - Forex Strategies ...
39# 5 min Channel - Forex Strategies - Forex Resources - Forex ...
26# Double Channels - Forex Strategies - Forex Resources - Forex
322# Channel 50 EMA two methods - Forex Strategies - Forex ...
10# SRDC Method Level II - Forex Strategies - Forex Resources ...
59# Scalping With I-regression


Write a comment
Martin (Sunday, 06 August 2017 10:24)
This looks like a really safe but simple system will give it a try defo