


299# How the “COT Super / EdgeFinder” Indicator Works
A Complete Breakdown of Logic, Signals, and Market Interpretation
Janus Trader 2025
Introduction
The COT Super (EdgeFinder) indicator is a comprehensive
institutional-grade trading framework built on Commitment of Traders (COT) data, enhanced with
trend analysis, volatility, volume, seasonality, macro inputs, and risk management logic.
Rather than producing simple buy/sell signals, the indicator aims to answer three critical questions:
-
Who is in control of the market?
-
What phase is the market in (trend, reversal, squeeze, distribution)?
-
How should risk and position size be managed right now?
The result is a decision-support system, not a mechanical indicator.
1. Core Philosophy: Follow Smart Money, Not Price Alone
At the heart of the indicator is COT positioning, divided into:
-
Commercials (hedgers / smart money)
Large Speculators (funds, trend followers)
Small Speculators (retail / non-reportable)
The indicator assumes:
-
Commercials lead turning points
Speculators fuel trends
Extreme alignment increases risk
Opposition between commercials and specs creates opportunity
All calculations revolve around net positions, weekly changes, and relative positioning extremes.
2. COT Data Processing and Normalization
Net Positions
The script pulls legacy COT data directly from TradingView’s COT library and calculates:
-
Commercial long vs short
Speculator long vs short
Net exposure and weekly deltas
Percentage Positioning
Positions are normalized into percentile ranges (0–100%), allowing the system to detect:
-
Extreme long crowding
Extreme short crowding
Neutral positioning zones
This normalization is critical because raw contract numbers alone are misleading across different markets.
3. COT-Based Market States
The indicator classifies market behavior into advanced structural patterns, including:
Accumulation
-
Commercials quietly add positions
Specs remain inactive or positioned incorrectly
Often occurs near market lows
Distribution
-
Commercials reduce exposure
Specs continue adding in the trend direction
High probability of reversal
Squeeze Conditions
The script detects:
-
Short squeezes (specs heavily short, forced covering)
Long squeezes (specs overly long, forced liquidation)
Each squeeze is assigned a pressure score, reflecting potential intensity.
4. EdgeFinder Composite Score
A defining feature of the indicator is the EdgeFinder Score, scaled from –18 (very bearish) to +18 (very bullish).
This score combines weighted components:
|
Component |
Weight |
Description |
|---|---|---|
|
COT Score |
~35% |
Smart money positioning |
|
Trend Score |
~25% |
EMA alignment + ADX |
|
Volume Score |
~20% |
Participation confirmation |
|
Volatility Score |
~20% |
Risk and instability |
|
Seasonality |
Optional |
Historical tendency |
The final score is color-coded in the panel:
-
Green → Bullish dominance
Red → Bearish dominance
Gray → Neutral / transition
5. Trend Engine (Not Just Moving Averages)
The trend system is multi-layered:
EMA Structure
-
EMA 20 / 50 / 200 alignment
Directional hierarchy matters
ADX Filter
-
Ensures trends are strong, not just directional
SuperTrend
-
Used for confirmation and trailing bias
Integrated into risk and position management
The trend score is scaled, not binary, allowing nuanced interpretation.
6. Volume & Volatility Intelligence
The indicator does not assume volume is always bullish or bearish.
It evaluates:
-
Volume expansion vs contraction
Divergence between price and volume
Volatility regime shifts using ATR ratios
This feeds into:
-
Risk score
Position sizing
Setup validity
Low volatility + extreme positioning = compressed risk
High volatility + alignment = danger zone
7. Seasonality Engine
A unique component is the 10-year rolling seasonality model.
It calculates:
-
Average daily returns by calendar day
Historical volume tendencies
Reliability score based on sample size
Seasonality is weighted, not dominant, and only contributes when statistically reliable.
8. Setup Strength & Probability Analysis
Instead of fixed signals, the indicator computes setup strength (0–100) using:
-
Squeeze presence
Accumulation / distribution
Reversal patterns
Momentum shifts
Position imbalance
COT momentum
It also evaluates probabilities for multiple scenarios:
-
Trend continuation
Trend reversal
Range formation
Volatility expansion
Position squeeze
The top 3 scenarios are displayed in the analysis panel.
9. Risk Management Is Built In
Risk is not an afterthought.
The script dynamically adjusts:
-
Stop distance (ATR-based)
Position size
Scaling in and out
Risk classification (Normal → Extreme)
High-risk conditions include:
-
Commercials and specs aligned
Extreme net positioning
Rapid weekly changes
In such cases, the indicator explicitly recommends:
-
Reduced size
Wider stops
Or staying flat
10. News & Macro Integration
The indicator allows manual macro inputs (GDP, CPI, PMI, NFP, rates).
It compares:
-
Actual vs forecast
Actual vs previous
Directional surprise magnitude
Macro data does not override COT signals but adjusts conviction and risk.
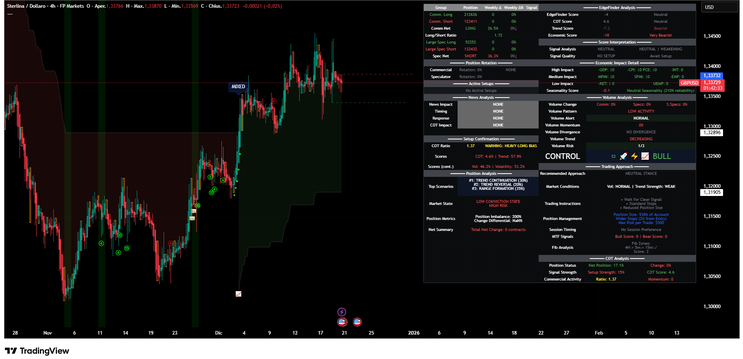
11. Reading the Chart (Image Interpretation)
From the attached image:
-
Price is consolidating after a strong impulsive move
COT panel shows mixed-to-bearish pressure
Trend strength is weakening
Volume activity is declining
Setup quality is neutral (await confirmation)
This reflects a low-conviction environment, where patience is favored over aggression.
12. What This Indicator Is (and Is Not)
It IS:
-
A professional-grade market context engine
Designed for swing and position traders
Built to reduce emotional decision-making
It IS NOT:
-
A scalping tool
A signal-only indicator
A prediction system
Conclusion
The COT Super / EdgeFinder indicator transforms raw COT data into a multi-dimensional market
model.
Its strength lies not in calling tops or bottoms, but in identifying when risk is
asymmetric, when institutions are positioning early, and when the crowd is vulnerable.
Indicator aimed at market analysts and writers.
Paid indicator. If you are interested, write to [email protected].
299#Gann HiLo and DMI Trading System
Submit by Nico 10/12/2012
“Gann Hilo DMI System” is a very simple trend trading system which is based on the signals of 3 forex indicator: Gann Hilo, DMI and QQE, the recommended interval - H1, the currency pair - GBPJPY (but may trade on other currency pairs) .
To establish indicators to trade forex, you can download at the end of this strategy, together with a template for MT4:
1) Indicator Gann Hilo (10)
2) Indicator DMI (14), just need to install the level 20
3) indicator QQE (10).
Opening trade position to buy - should the following conditions:
1) The red dotted line indicator QQE is below the blue line (crossed her top down) - The main signal!
2) Price crossed Gann Hilo from bottom up
3) blue line indicator DMI crossed and is above the level of 20
4) The body of the candle on the level close to the level of opening should be more than 3 points, if it is not, then this candle believe «Dodge» and open transaction on this candle is not necessary. If the size of the candles from opening until closing more than 90 points, then trade on the candlejust not necessary, because very high probability of recoil and get stop-loss on this candle.
In the picture Gann HiLo and DMI forex system in action.
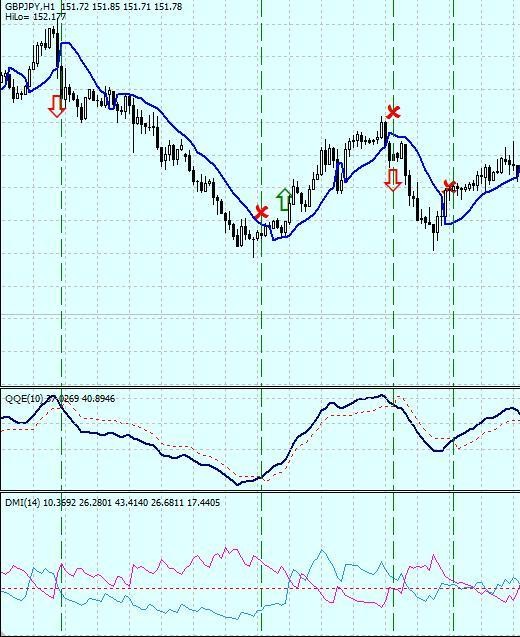
Opening a trading position for SELL - must be satisfied the following conditions:
1) The red dotted line indicator QQE is above the blue line (crossed it from the bottom up) - The main signal!
2) Price crossed Gann Hilo from top down
3) serenevaya DMI indicator has crossed the line and is above the level of 20
4) The body of the candle on the level close to the level of opening should be more than 3 points, if it is not, then this candle believe «Dodge» and open transaction on this candle is not necessary. If the size of the candles from opening until closing more than 90 points, then trade on the candle is not necessary, because very high probability of recoil and get stop-loss on this candle.
Entering the market is carried out only at the opening of the next candle after receipt andconfirmation of all signals:
This strategy is recommended to use only a safety stop-loss, which should be set at the nearest local minimum (for sale) or maximum (for sale).
Once the price will be in the direction of the trade position 75 points (for a pair GBPJPY), should be rearranged in the stop-loss level “zero”. Further (optional) You can use a trailing stop (including a standard at a distance of 75-100 points, depending on the market).
Take-profit is not installed!
Exit trading position:
Position closes when triggered stop-loss, or the reverse crossing indicator QQE. Leaving the market to perform at the closing of the candles after receiving the signal.
17# Gann HILO System - Forex Strategies - Forex Resources -
67# Absolute Strength With Pama Gann grid - Forex Strategies ...
68# MTF Gann Activator and Neuro Strength - Forex Strategies ...
140# Master Probability with Gann HILO MTF - Forex Strategies ...
69# Gann Hilo Activator, CCI and MACD - Forex Strategies - Forex
Gann Metatrader Indicator - Forex Strategies - Forex Resources ...
208# Gann, CCI and MACD - Forex Strategies - Forex Resources ...
299# Gann HILO DMI - Forex Strategies - Forex Resources - Forex
Forex books about Elliott Wawe, Fibonacci and Gann - Forex ...
343# Forex Gann Strategy - Forex Strategies - Forex Resources ...
139# Alpha Trader - Forex Strategies - Forex Resources - Forex ...
