

36# Inside Bar with MACD Forex Trading System
Submit by Maximo Trader ( Written by Suniel) 30/06/2012
Technical analysis used for predicting price action in the financial markets, is just another factor to put the odds in favour of the trader.
But relying on any single indicator to provide signals for a trade is not advisable. Since indicators are derived from price action, they usually are lagging and would confirm a signal only after the move has been initiated.
If we have another factor confirming the same signal, the probability of a successful trade is increased.
The second confirming factor could be another indicator, but ideally the price action should confirm the signals shown by the indicator.
In this regard candlesticks are found to be very effective.
We will have look at a system combining the MACD indicator, along with a candlestick Inside Bar. This system can be used effectively on a higher time frame, from the 4hour to the Monthly.
Let us first understand the basics of each of these.
The Moving Average Convergence Divergence (MACD) is one of the most popular technical indicators in technical analysis, since it can be used either as a trend or momentum indicator.
This indicator is made up of the MACD line and the signal line. Since it also doubles up as an oscillator, it comprises of a range with the centerline denoting the zero line.
It is also represented by a histogram, which is nothing more than a visual representation of the difference between the MACD line and the signal line.
The distinct advantage of this indicator is we can identify a trend simply by observing if the MACD signal line / histogram is above or below the zero line.
While it also interprets if a price is overbought/oversold, we will concentrate only on the trend part for now, which we can briefly describe as:
The MACD line/signal line crossovers - when the MACD falls below the signal line it is a bearish signal, which indicates that it may be time to sell. Conversely, when the MACD rises above the signal line, the indicator gives a bullish signal, which suggests, the price is likely to gain upward momentum. It is safer to wait for a confirmed cross above the signal line before entering into a trade.
2. Zero line - When the MACD is above zero, the short-term average is above the long-term average, which signals upward momentum - the opposite is true when the MACD is below zero. This zero line often acts as an area of support and resistance for the indicator.
An Inside Bar forms when a currency has a small range day as compared to the previous days range. This simply means it is a bar with a lower high and a higher low than the previous bar.
As can be seen in this example, the current bars high and low are within the range of the previous bar. This is often interpreted as price taking a breath and being uncertain of the direction of the market. Subsequently the breakout of this bar causes volatile movements.
When we combine the characteristics of these two entities, we can effectively form a system with the following conditions:
Trade Entry- When the MACD is above the zero line, the high of the Inside bar should be used as a buy stop. This simply means that we anticipate a breakout to the long side, since the MACD is in the positive zone and hence we place our buy orders above the high of the inside bar.
Similarly the low of the Inside bar should be used for a sell stop when the MACD is below the zero line.
Stops- If triggered, the stops should be placed below the low of the Inside Bar in case of a long trade, and above the high of the Inside Bar for a short trade.
Since we can afford to keep tight stops, the risk to reward ratio for the trades is usually very high.
Exit - It is advisable to follow the trades with a trailing stop to lock in the profits, since we do not have a specific exit defined for this strategy.
Situations when the strategy would not be effective– In a range bound market when price is consolidating, we could have Inside Bars forming due to price having small ranges, and the MACD would be also flat around the zero line. In such cases it is better to stay out, till we have a noticeable movement in price.
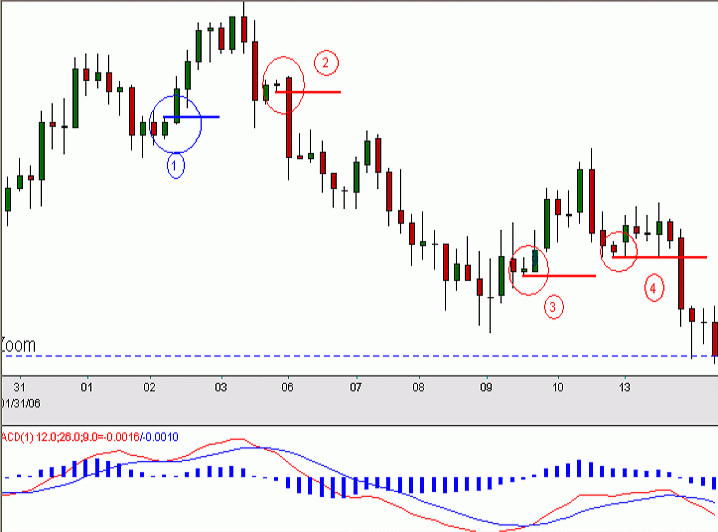
Let us see the applications in the following example –
In the set-up marked (1) – we observe the MACD as soon as we have an Inside Bar. In this case, the MACD lines as well as the histogram are both in the positive zone indicating a strong upward momentum. Hence we place our buy order above the high of the Inside bar.
In the set-up marked (2) – the MACD lines have crossed downwards, and the histogram has closed below the zero line. This indicates a downward momentum and we place our sell order below the low of the Inside bar.
Similarly in the set-up marked (4) – the MACD lines are in the negative territory. Even though the lines have crossed upward, they are still below the zero line, indicating a continuing downtrend. Hence we place our sell order below the low of the Inside bar which gets triggered after price completes the retracement / consolidation.
It is important to note that we are not entering a trade simply on the formation of the Inside bar. We are entering the trade on a Buy/Sell Stop order, effectively letting the market confirm our trade.
This can be seen in the setup marked (3), where we place a sell order below the low of the inside bar. This order is not filled as price retraces up, and it keeps us out of a losing trade.
What we have done is combined the characteristics of these two to achieve a higher probability for a trade.
As we can see in the chart, the setups give us a precise point to enter a trade. If we would have relied solely on the signal provided by the MACD, we could not have pin-pointed the exact entry.
The identification of this system or the set-up is the Inside Bar.
In effect, we are waiting for price to catch its breath, anticipating that the breakout will be volatile.
And then use the MACD to give us the clues for the direction.
While this may not work all the time, it should at least keep us out of losing trades.
Inside Bar Pattern Forex Strategies
Inside Bar Metatrader Indicator - Forex Strategies - Forex Resources ...
10# Inside Bar - Forex Strategies - Forex Resources - Forex
26# Inside Bar and Stochastic - Forex Strategies - Forex
27# Inside Bar Pullback - Forex Strategies - Forex Resources ...
18# Inside Bar System II - Forex Strategies - Forex Resources ...
32# Inside Bar with Bollinger Bands - Forex Strategies - Forex ...

wan (Thursday, 22 February 2018 07:33)
Please to share to me
Thank you sir.
anrymisza@gmail.com