

9# Butterfly Patterns Forex Trading System
Submit by Joy22
The Butterfly pattern was discovered by Bryce Gilmore and Larry Pesavento. Many traders believe that a Butterfly Pattern offers more precise signals as opposed to most other Potential Reversal Zones (PRZ) and they offer more significant trading opportunities.
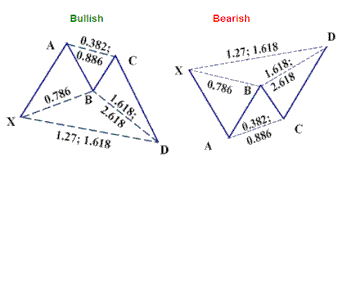
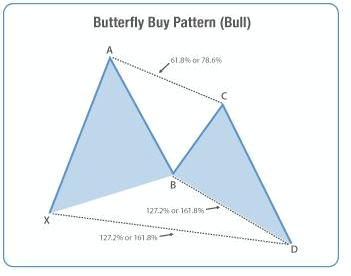
The "Butterfly" pattern has a distinct retracement level (0.786) of XA swing. In bullish and bearish 5-point swings, the pattern must have 0.786 to 0.886 of XA swing to be valid. In perfect "Butterfly" patterns, the AB swing will be equal to CD (AB=CD).
"Butterfly" patterns usually occur at market tops and market bottoms. The pattern's success rate is much higher when the retracement and time ratios are harmonically aligned.
The AB retracement must be 0.786 in the "Butterfly" pattern. The D point extends beyond the X and the C level can be inside or outside of the XA range. The retracement of AB defines level D. In Butterfly patterns, if B is formed at 0.786, the usual retracement of D could be near 1.27 of XA range.
Convergence of Fibonacci extension ratios may provide higher probability for change in market direction May provide lower risk with potential for higher reward. Pattern failure may suggest a strong continuation move. Butterfly patterns are similar to Gartley patterns in that they resemble a “M” shape on a price chart. However, a butterfly pattern completes at the convergence of two separate Fibonacci extension levels, whereas the Gartleycompletes at the convergence of a Fibonacci retracement and extension.
The symmetry between the two connecting triangles at point B is one of the keys to this pattern. As with all geometric patterns, a buy or sell signal occurs as the pattern completes at point D.
Trading the Butterfly Pattern Once the Butterfly pattern is completed in PRZ level, wait for a confirmation bar, wide range bar or "higher high" close bar to suggest a potential reversal from "D" level. Enter one tick above the high of the confirmation bar.
Setting Targets Targets are set at 100% of AD and 162% of XA from D levels. In bullish butterfly patterns, beyond the A level, targets need to be protected with trailing stops.
Stop Losses
Place a "stop" order below (bullish) the low of the "Butterfly" pattern. For bearish Butterfly patterns, place a "stop" order above the high of the "Butterfly" pattern.
Butterfly Pattern Rules:
1. Butterfly patterns usually appear where price extremes are being re-tested and sometimes making a "false break". See the image below: 2. Look for patterns around major support/resistance areas. 3. Completion of AB=CD is usually extreme (1.27, 1.386 or 1.618 fib extension). 4. Point A is the highest/lowest point in the pattern. 5. Point C can not exceed point A. 6. In a bullish pattern point D is the lowest. In a Bearish pattern point D is the highest. I believe there is a higher probability of the trade working out if it reverses within the red box which is known as the “Potential Reversal Zone”. Once it moves out the box and consolidates the probability decreases.
The Money Flow Index indicator is used purely as a gauge to give me a feel of the condition of the market, but I do not enter a trade based on this indicator. Pattern structure is far more important.
Example:
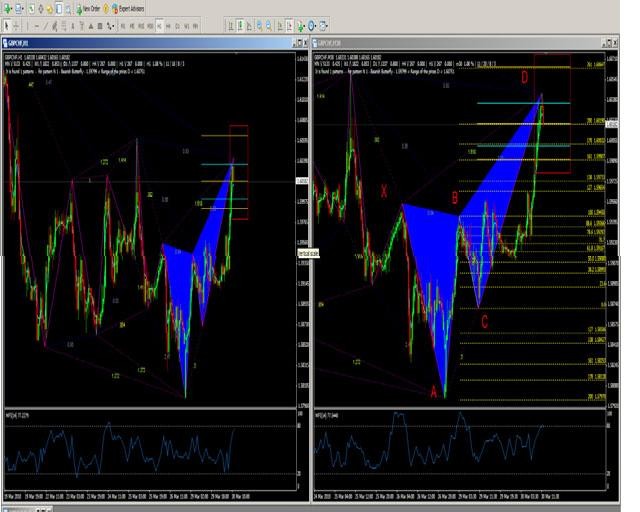
Bearish Butterfly Example:
In this example, a 30 minute and 1 hour pattern was found. On the 30 minute chart, drag the Fibonacci Retracement tool from the high of X point to the low of A point.
A Bearish Butterfly is expected to complete between the 127%, 132%, 1.618% + 2.618% Fibonacci Extension levels.
I would trade this pattern based on the bearish candle formation (ideally as close as possible to the 2.618% Fibonacci level). So I entered short positions at point D (Potential Reversal Zone)
-
Target 1 = B Point 2. Target 2 = C Point 3. Stop Loss is always 5 pips above the potential reversal zone. 4. Move your stop loss to break even once first target is met. 4

Bull Butterfly Example:
On the 15 minute chart, drag the Fibonacci Retracement tool from the low of X point to the high of A point.
A Bearish Butterfly is expected to complete between the 127%, 132% or 1.618% Fibonacci Retracement level.
I entered this pattern at point D (Potential Reversal Zone) based on the price action slowing down and suggestions from MFI that price are over sold.
1. Target 1 = B Point 2. Target 2 = C Point 3. Stop Loss is always 5 pips above the potential reversal zone. 4. Move your stop loss to break even once first target is met
Share your opinion, can help everyone to understand the forex strategy.
Retracement Forex Strategies
38# Kevinator Retracement - Forex Strategies - Forex Resources
88# Riding The Trend after Retracement - Forex Strategies - Forex
12# Bollinger Bands and Fibonacci Retracement - Forex
29# MACD Retracement - Forex Strategies - Forex Resources ...
43 # ForexScalp Retracement - Forex Strategies - Forex
61# The Retracement Market Method - Forex Strategies - Forex ...
1# Fibonacci Retracement - Forex Strategies - Forex Resources ...
76# EMA's Retracement - Forex Strategies - Forex Resources ...
49# CCI and Stochastic Retracement - Forex Strategies - Forex ...
39# Fibonacci Retracements, Fibonacci extensions, Fibonacci ...
13# Parabolic SAR and Fibonacci - Forex Strategies - Forex ...
82# Ema's and MACD - Forex Strategies - Forex Resources - Forex
8# Fibonacci Fan - Forex Strategies - Forex Resources - Forex ...
9# Butterly Patterns - Forex Strategies - Forex Resources - Forex ...
6# Trend line Breakout and Fibonacci - Forex Strategies - Forex ...
116# Trendline Forex Entry Signal, Two High Probability Setups
37# ADX and EMA - Forex Strategies - Forex Resources - Forex ...

chuck (Tuesday, 26 June 2018 19:24)
been reading lots of these harmonic pattern explanations. Yours confuses me because of the AB = CD
I think it should have read XA = CD
ragul (Friday, 25 May 2018 04:13)
hey!, i used this indicatoe but i can see only but trade. it didnt generate any sell trade. may i know why?