


103# Day Trading GBP/JPY
Submit by Joy22
The Rules
Currency to be traded: GBP/JPY
Chart timeframe: 5 minutes
Bollinger Bands setting: 20,2,SMA
Step 1
We start viewing the 5 min GBP/JPY at exactly 00:00. We wait for
the RSI indicator to either reach a reading of 70 or a reading of 30.
The first reading that is reached will dictate if the trade is going to
be a long trade or a short trade. If RSI reaches first a reading of 70
the trade will be short. If RSI first reaches 30, the trade will be
long.
Step 2
For short trade: we wait for market to penetrate lower part of
Bollinger band by 3 pips and initiate trade at that same exact price.
For long trade: we wait for market to penetrate upper part of
Bollinger band by 3 pips an initiate trade at that same exact price.
Step 3
We immediately place out stop loss at 20 pips from entry.
We place out take profit order at 50 pips from entry price.
Examples
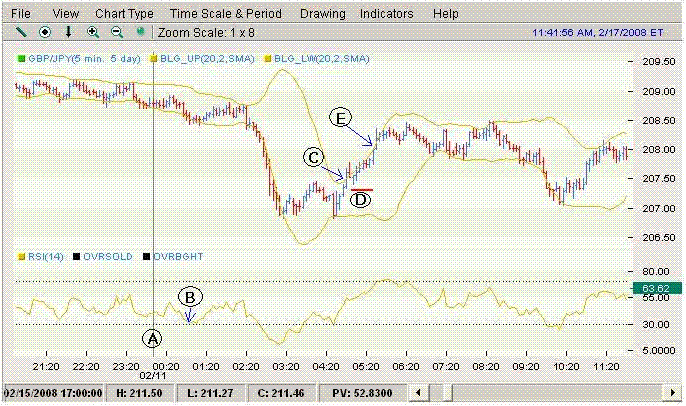
We will quickly go over this first trade example so you can see
how the trade worked out from start to finish on the same chart. On
the next trade example I will be more specific in my explanation.
A: 00:00, start time.
B: RSI reaches 30 first. This means we will be looking for a long
trade.
C: We where looking for market to penetrate upper part of
Bollinger band by 3 pips and it did at 207.53. Long trade is
triggered.
D: Stop loss is immediately placed 20 pips from entry at 207.33.
E: Profit target of 50 pips is reached at 208.03
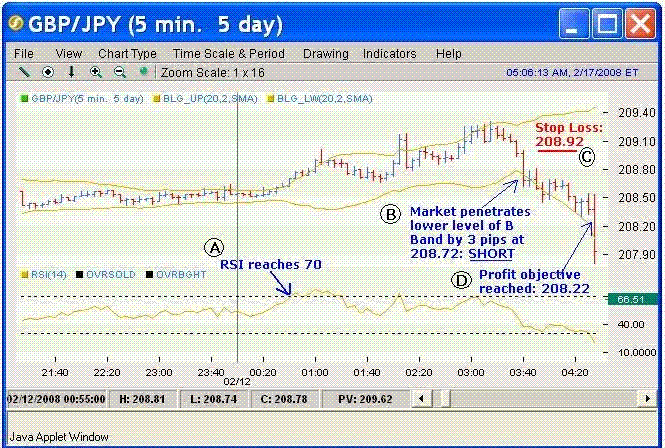
So, we can see that at point A the RSI reaches 70. This means that
we will be looking for a short trade. If it was the opposite and the
RSI would have reached 30 first we would have been looking for a
long trade.
At this point the RSI does not concern us anymore and what
matters now is the market price and the Bollinger band. We are
now waiting for the market to penetrate the lower part of the
Bollinger band by 3 pips, and it does so at point
B. We enter ashort trade at 208.72 and immediately place our stop loss 20 pips from entry or 208.92 (point C). After stop loss is placed we either wait for the market to reach our profit objective of 50 pips or we enter a take profit order with our forex broker. At point
D we cansee the market easily reached out profit objective and the trade turned out to be a 50 pip winner.

A: 00:00, start time.
B: RSI reaches 30 first. This means we will be looking for a long
trade.
C: We where looking for market to penetrate upper part of
Bollinger band by 3 pips and it did at 209.89. Long trade is
triggered.
D: Stop loss immediately placed 20 pips from entry at 209.69.
Market reached our stop loss and trade got stopped out for a loss of 20 pips.
E: As per the system rules we re-enter trade at 210.08 (3 pip
penetration of Bollinger band). In this occasion it was a long trade but could have been a short trade as well if the opportunity would
have appeared first.
F: Stop loss immediately placed at 209.88.
G: Profit target of 50 pips is reached at 210.58.

A: 00:00, start time.
B: RSI reaches 70 first. This means we will be looking for a short
trade.
C: As expected the market penetrated the lower part of Bollinger
band by 3 pips at 212.36. Short trade is triggered.
D: Stop loss immediately placed 20 pips from entry at 212.56.
Market reached our stop loss and trade got stopped out for a loss of 20 pips.
E: As per the system rules we re-enter trade at 212.91 (3 pip
penetration of Bollinger band). In this occasion it was a long trade
but could have been again a short trade as well if the opportunity
would have appeared first.
F: Stop loss immediately placed at 212.71.
G: Profit target of 50 pips is reached at 213.41.
Bollinger Bands Forex Strategies
Bollinger Bands Forex Strategies
5# Bollinger Bands Pin Bar and Real MACD
8# Bollinger Bands Multitimframe
9# Bollinger Bands and the Gimmees bar
11# Bollinger Bands Breakout and RSI
12# Bollinger Bands and Fibonacci Retracement
14# Bollinger Bands, RSI and Stochastic
16# Bollinger Bands with ADX, RSI and Two MA
17# Bollinger Bands with Equidistant Channel
18# Bollinger Bands and RSI Divergence
20# Bollinger Bands and Stochastic

Forextradingstrategiesresources (Wednesday, 12 June 2013 21:47)
Yes, GMT.
Abhijit Barua (Wednesday, 02 January 2013 10:36)
103, the 00:00 start time is GMT?