

594# Stochastic OS/OB Strategy
Stochastic Overbought and Oversold
Value chart trading with Stochastic OS/OB with Support and Resistance
Submit by FreddyFX
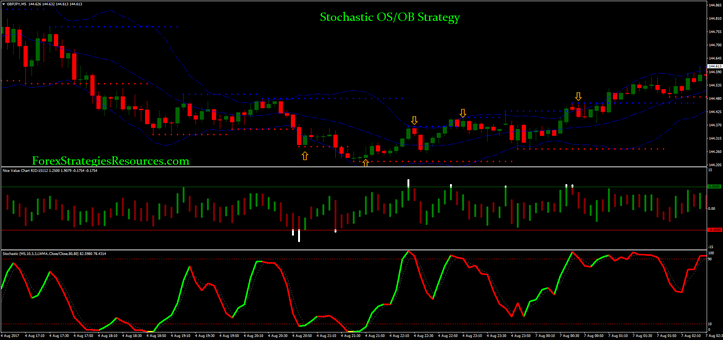
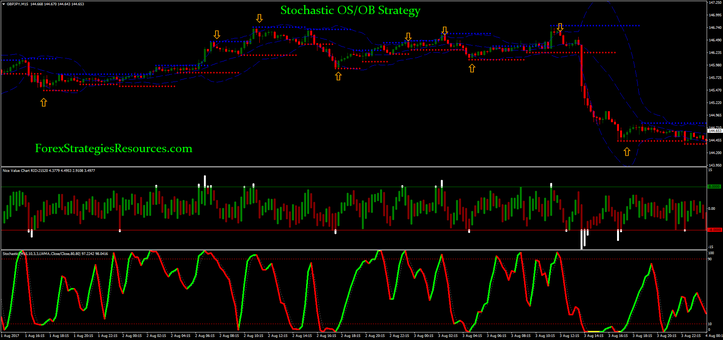
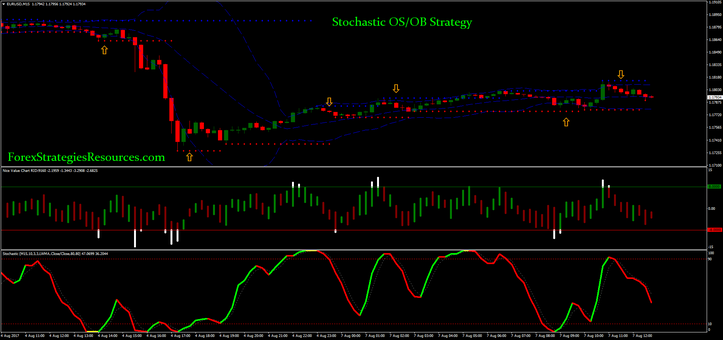
Stochastic OS/OB Strategy is a trend reversal strategy based on bollinger Bands, stochastic oscillator, Support and Resistance levels and Value Chart for direction of the trades.
Time frame 5 min or 15 min.
Currency pairs: majors with low spreads.
Metatrader Indicators:
Bollinger Bands (period 20, deviation 2.0),
Supprt RTF period 11,
Nice Value chart V.1.0,
Stochastic oscillator (10, 3, 3) with level (10 – 90).
Trading rules Stochastic OS/OB Strategy
Buy
Price outer the lower band of BB.
Value chart with white bar.
Red dot support level.
Stochastic crosses upward the 10 level (green color line).
Place a buy order at opening of the next candle.
Initial stop loss at the privious low swing.
Make profit with fast profit that depends by time frame and pairs, max ratio stop loss 1:1.
Sell
Price outer the upper band of BB.
Value chart with white bar.
Green dot resistance level.
Stochastic crosses downward the 90 level (green color line).
Place a sell order at opening of the next candle.
Initial stop loss at the privious low swing.
Make profit with fast profit that depends by time frame and pairs, max ratio stop loss 1:1.
You can use, for money management the martingale. Multiplier range min 1.4 – max 2.0.
In the pictures Stochastic OS/OB Strategy in action.
Share your opinion, can help everyone to understand the forex strategy.
|
|
|
|
|
|
|
|
|
|
|
|
|
|
