


9# Key levels : A Clear Guide to Structure, Levels, and Trading Logic.
Joy22
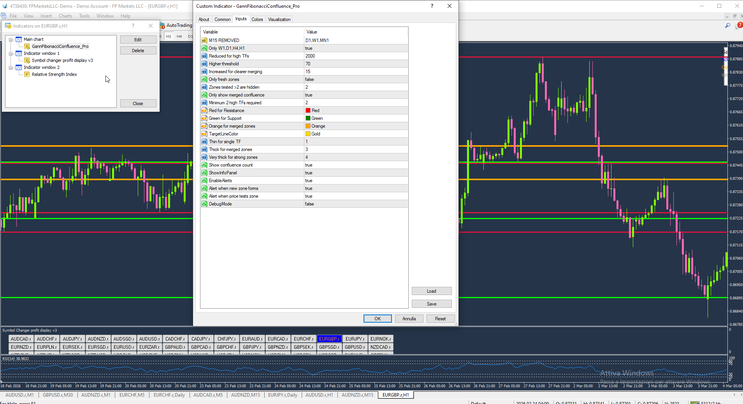
Key levels indicator is designed to simplify price action by highlighting key institutional levels, reaction zones, and market structure across multiple timeframes. Instead of cluttering the chart, it organizes price into clear areas where reactions are most likely to occur.
At its core, the indicator identifies important zones where the market has previously shown strong buying or selling interest. These zones are divided into resistance levels, support levels, golden zones, and fresh levels. Each of these plays a specific role in helping traders understand where price might react next.
Resistance levels, usually shown in red, represent areas where price has previously struggled to move higher. These zones often act as ceilings, and when price approaches them again, there is a higher probability of sellers stepping in. Traders typically watch for bearish signals in these areas, such as rejection wicks or strong downward candles, before considering a short position.
Support levels, marked in green, are the opposite. They represent areas where buyers previously entered the market and pushed price upward. These zones act as floors, and when price returns to them, traders look for signs of strength, such as bullish candles or quick rejections, to consider long positions.

One of the most important features of this indicator is the concept of fresh levels. A fresh level is a price zone that has not yet been revisited after it was formed. These levels tend to be more powerful because the liquidity in that area has not yet been used. The first time price returns to a fresh level, it often produces the strongest reaction, making it a high-probability trading opportunity.
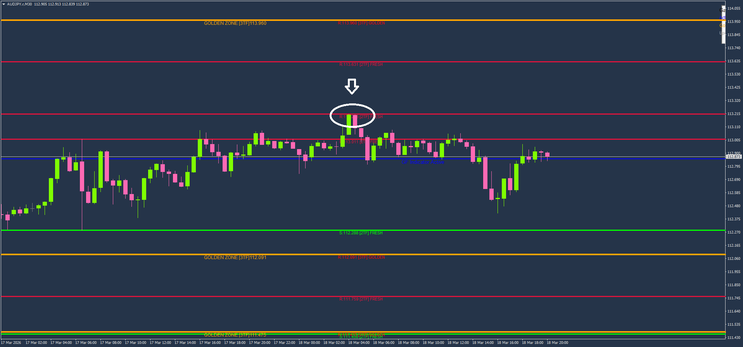
Another key component is the golden zone, usually highlighted in orange. These zones are derived from higher timeframe confluence, meaning they combine important levels from multiple timeframes. Because of this, golden zones represent areas where the probability of a strong reaction is significantly higher. Traders often treat these zones as premium areas for entries, especially when they align with fresh support or resistance levels.
The indicator also includes a central or active level, often shown in blue. This level acts as a short-term equilibrium point. When price is above it, the market tends to have a bullish bias, while trading below it suggests a bearish bias. This helps traders quickly understand the current market direction.
A major strength of this indicator is its use of multi-timeframe analysis. Higher timeframe levels tend to be stronger and more reliable, while lower timeframe levels provide more precise entry points. When levels from different timeframes align, they create what traders call confluence, which significantly increases the probability of a successful trade.
When reading the chart, traders can interpret different scenarios based on how price interacts with these levels. If price approaches resistance and shows rejection, a downward move is likely. If price approaches support and shows strength, an upward move becomes more probable.
When price breaks a level, many traders make the mistake of entering immediately. However, this is not the correct approach. A breakout alone does not confirm a valid move, and the market often creates false breakouts or liquidity grabs.

Keeping the Chart Clean: Focus on Higher Timeframe Levels
When a chart shows too many lines, it can quickly become confusing and reduce decision-making clarity. Not all levels carry the same importance, and overloading the chart often leads to hesitation or poor entries.
For this reason, it is often better to focus only on the most important key levels derived from higher timeframes, such as the Daily, Weekly, and Monthly levels.
These levels tend to be significantly stronger because they represent areas where large market participants are more active. Reactions from higher timeframe levels are generally more reliable and produce clearer price movements.
By keeping only Daily, Weekly, and Monthly levels on the chart, traders can reduce noise, improve clarity, focus on high-probability zones, and avoid overtrading lower-quality setups.
Lower timeframe levels can still be useful for refining entries, but they should not dominate the chart. The primary focus should always remain on the higher timeframe structure.
In short, less is more: a clean chart with only the most relevant levels often leads to better trading decisions.
Do not trade the breakout — trade the new structure.
After a breakout, the correct approach is to wait for price to stabilize and form a new level. This means allowing the market to break the level, consolidate, and clearly establish a new support or resistance. Only then should a trade be considered, ideally on a retest of that newly formed level. This approach provides more confirmation and reduces unnecessary risk.
Another important scenario occurs when price enters a golden zone. In these areas, volatility often increases, and the market is more likely to produce a strong reaction, either reversing or continuing with momentum. These zones should always be treated with attention and patience.
In ranging conditions, price tends to move between support and resistance. In this case, traders can adopt a simple approach: buying near support and selling near resistance, always waiting for confirmation before entering.

Final Thoughts
This indicator helps traders focus on what really matters: where price is most likely to react. By combining fresh levels, golden zones, and multi-timeframe structure, it provides a clear framework for identifying high-probability setups while reducing unnecessary noise.
When adding images to this article, it is useful to highlight examples of price reacting at fresh levels, rejecting from golden zones, breaking and retesting key levels, forming new structure after breakouts, and moving within a range. This will make the explanation even more practical and easier to understand.

9# SRDC Level I Trading System
SRDC Forex Trading Method
Submit by janusTrader (write by Orange Roshan)
OrangeRoshan’s SRDC method
This is the simplest way to make profits in forex trading known to me.
Even my grandmother, when she is still alive (bless her soul), can also
trade effectively. It is also very profitable. I think many professional
traders use this method.
It can be applied to all trading platform and need very minimal training
or experience in forex. The reason is because this method doesn’t use
any indicator at all. All you need to know is how to draw 3 types of
line:
1) Support
2) Resistance
3) Trendline
Before the Internet trading era, we trade currencies based on
fundamentals and the use of the three lines. Now, I don’t see why we
still cannot use it.
The Daily Chart
Has anyone studied the daily chart lately? I have a friend who trade
mostly on Daily chart only. His name is Warren Buffet, you might know
him! Heheheee….
Now, open your daily chart (candlestick preferably) on your favourite
major pair and watch closely. Take 1 minute and tell me what you
notice (Don’t read the text below yet)?
THERE IS NOT A SINGLE BAR EQUAL TO THE BAR NEXT TO IT!
Based on this fact, we can safely assume that, the highs and lows of a
daily candles are unique EVERYDAY (daaaaa…).
Now do this:
1) Draw support and resistance on any of the previous bar. For
newbies and JaJa Binks, Support is the lowest price of the candle
and Resistance is the highest price of the candle. Draw
horizontal lines.
2) Do you see the next candle penetrating the lines?
a. YES: That’s your trade
b. NO: No Trade
SHORT when it penetrates the support line and LONG when it passes the resistance.
In the pictures SRDC Level I forex system in action.
Now do this:
1) Backtest on as many candles as you like, minimum 20
candlesticks
2) Study the number of pips for every available trades (minus
spread)
3) How many candles give minimum 5pips?
4) How many candles give more than 10pips?
5) How many candles give less than 5pips?
Now you have the answer. ARE YOU EXCITED? You should be!
HOW TO TRADE THIS METHOD?
The Preparation
Upon the start of a new Daily candle;
1) Draw the Support
2) Draw the Resistance
….on yesterday’s candlestick please!
Draw the trend lines and determine the trend. This way, you can
expect where the price will go. It is either towards the Support
(bearish) or towards the Resistance (bullish).
Taking the trade
It all depends on you, whether you want to babysit the trade or ready
and leave the trade.
Either way, you can still profit from it.
Babysitting – Put a pending stop buy or/and stop sell orders. Wait until
it penetrate either lines, move your stoploss accordingly and deploy
traillock when you have to.
Ready & Leave – Like the above, but with an assign takeprofit and
stoploss. I would recommend a 5pips or 10pips maximum. Why?
Because, some bars only (very few) gives maximum 5pips.This way,
losing trade is almost non-existance!
Things to remember and my recommendation only:
1) Pick low spread pairs because of obvious reason.
2) When placing pending orders, please don’t forget to include the
spread + 1 or 2 pips as an extra precaution. Because
sometimes the force is not with us (don’t want the order to be
executed on the line and the price reverse!).
3) Watch the monthly / weekly highs and lows. I would avoid a
trade when it is near to the H&L. Price might reverse against
your favour before it hits your takeprofit.
4) Don’t trade to many pairs, maximum 3 pairs only, GBPUSD
EURUSD AUDUSD. Why? Your margin might not allow it.
5) I usually use stoploss of 20-30.
English is not my native language so please forgive my Yoda’s
grammer and I hope you find the SUPPORT & RESISTANCE DAILY
CANDLE method helpful and simple to use.
25# Channel Strategy - Forex Strategies - Forex Resources -
123# ATR Channels Strategy - Forex Strategies - Forex
13# Donchian Channels - Forex Strategies - Forex Resources ...
13# Fibopivot Channel Strategy - Forex Strategies - Forex ...
11# Keltner Channels and EMA - Forex Strategies - Forex ...
31# ADX and Moving -Average Channel - Forex Strategies - Forex
16# Moving Average Channel and Parabolic Sar - Forex
77# Two MA Channel - Forex Strategies - Forex Resources -
111# Mj Regression Channel and FX Sniper Ergodic CCI - Forex ...
66# Envelope Reversal - Forex Strategies - Forex Resources -
5# Channel Breakout and Moving Average - Forex Strategies ...
153# Dynamic Channel, Contrarian Strategy. - Forex Strategies ...
2# Volatility breakout channel - Forex Strategies - Forex
17# Bollinger Bands and Equidistant Channel - Forex Strategies ...
10# SRDC Method Level II - Forex Strategies - Forex Resources ...
12# SRDC Method Level III - Forex Strategies - Forex Resources ...
9# SRDC Method Level I - Forex Strategies - Forex Resources ...
Volatility Forex Strategies - Forex Strategies - Forex Resources ...
2# Volatility breakout channel - Forex Strategies - Forex
123# ATR Channels Strategy - Forex Strategies - Forex Resources
7# ATR Breakout - Forex Strategies - Forex Resources - Forex ...
6# ATR Channel Breakout - Forex Strategies - Forex Resources ...
Autotrend Channel Trading System
