


165# TMA Overlay for TradingWiew -TradingView Strategy
TMA filtered
Trend following strategy
Submit by Tommy Gun
In this short article I address the question of a possible use among the many of the TMA Bands Overlay, a custom indicator of the TradingView platform. The interpretation I show is trend following but it could also be used as a trend-reversal trading method. Here, therefore, I address the issue of how to use this indicator to generate signals in the direction of the trend.
I look at the combination of two
types of TMA from a non-algortmic graphical point of view.
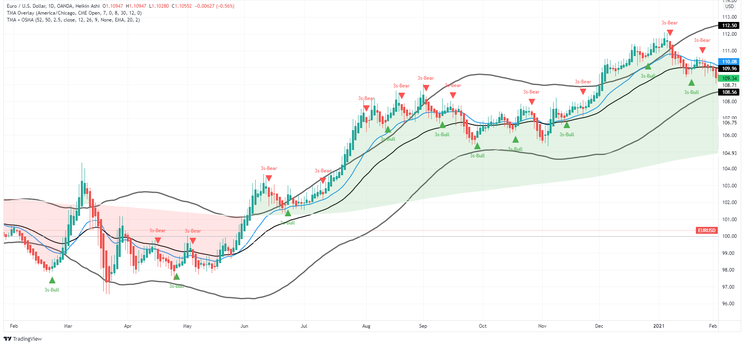
The trend is determined by the crossing of two moving averages of the TMAs. When the gray line is greater than the black one, the trend is upward, and, therefore, only the bullish signals are
considered, when the gray line is less than the black one, only the bearish signals are evaluated.
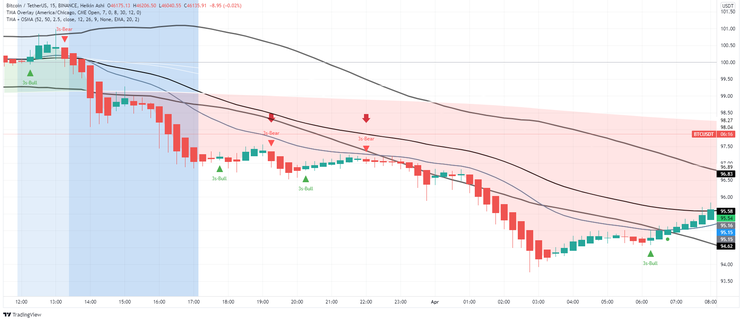
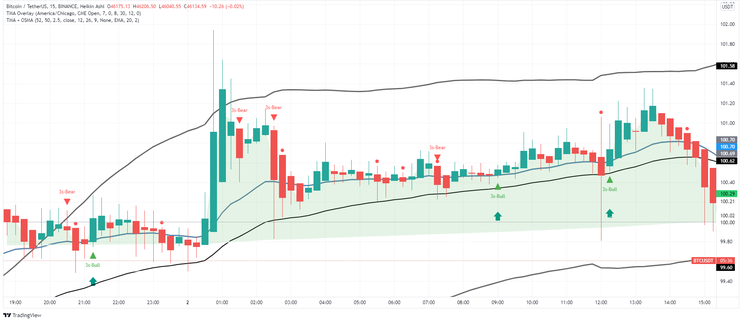
The buy and sell signals seen on the chart are generated by the TMA Overlay.
Setup strategy
Time frame 15 minutes or higher. Best higher time frames.
Currency pairs any.
Platform: TradingView.
Trading rules
Trade only in the direction of the
trend.
Trend up gray line> black line.
Trend down gray line less than black.
Buy
Trend up + buy arrow.
Sell
Trend down + sell arrow.
Exit position
Place initial stop loss at the previous swing high/low.
Profit target at opposite signal or when there is the opposite intersection of the gray line with the black one.
Exmples of trades.


Kamran Wazir (Sunday, 03 November 2024 17:17)
Hello,
Please send me the file of 165# TMA Overlay for TradingWiew -TradingView Strategy.
my email address is : [email protected]
Regards
Frank (Thursday, 10 October 2024 17:10)
I love this web site there are many forex resources, this another great strategy. Thanks
You are bonaaaaaa!!!!
Ruslan (Saturday, 30 April 2022 15:57)
Hi. Can I get you 165# TMA Overlay for TradingWiew -TradingView Strategy system? [email protected]