

728# DSS arrow
Stochastic trend trading
Submit by Simon 30/0172017
DSS arrow is a simple trend-momentum strategy based on two indicators DSS arrow and slope indicator. This strategy is good also if applied with renko chart ( box size 5 pips or higher).
Time frame 30 min or higher.
Financial marketes:any.
Renko chart box size 5 pips or higher.
Metatrader Indicators
DSS Bressert arrow TT
filter (slope indicator)
Renko live chart 600.
Trading rules DSS arrow
Buy
DSS Bressert arrow TT arrow buy.
filter (slope indicator) green line.
Sell
DSS Bressert arrow TT arrow sell.
filter (slope indicator) green line.
Exit position
Exit at opposite arrow or when slope change direction (color).
Place initial stop loss on the previous swing high/low.
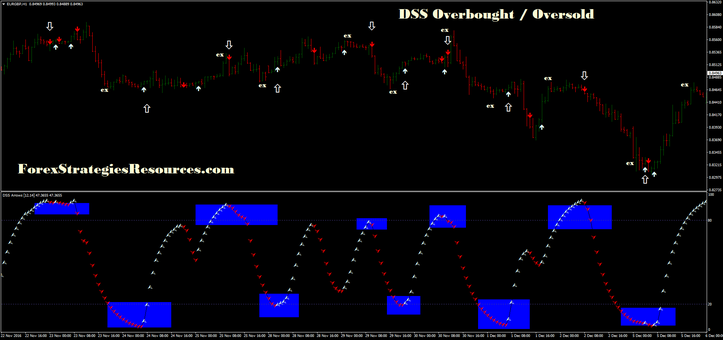
Overbought / Oversold
Find on the time frame daily value in range.
open the chart 4H or 1H and trading only with DSS overbought / oversold.
See example.
Exit when the oscillator DSS reach the opposite area.
In this case, it is very important to choose an exchange in range.
In pictures DSS arrow in action.
DSS range trading
|
|
|
|
|
|
|
|
