


3-Color Trend Wave" Trading Strategy
Dimitri 2025
3-Color Trend Wave" Trading Strategy is a trend following strategy for day trading.
1. Best Trading Times
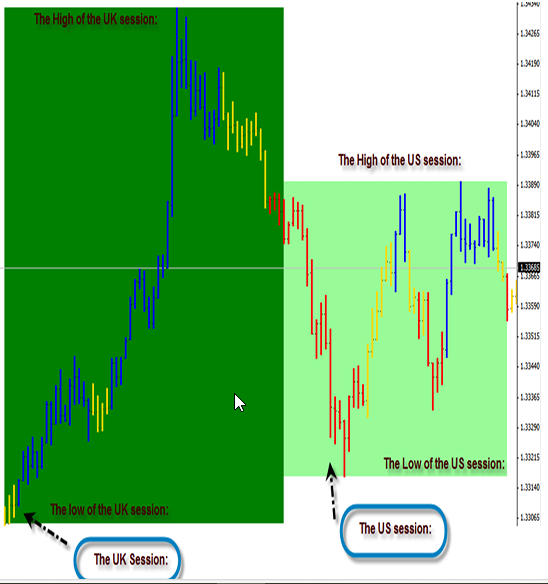
Only trade during the following Forex sessions, using the Forex Trend Wave Market Times indicator:
-
UK Session: 3:00 AM to 8:00 AM EST
-
US Session: 8:00 AM to 12:00 PM EST
⚠️ Never enter trades near the end of a session — price may reverse unexpectedly.
📊 2. Indicators Used
-
Forex Trend Wave Market Times Indicator (shows session boxes)
-
Color Bar Trend Indicator:
-
🔵 Blue = Bullish
-
🟡 Gold = Transition / Trend Shift
-
🔴 Red = Bearish
-
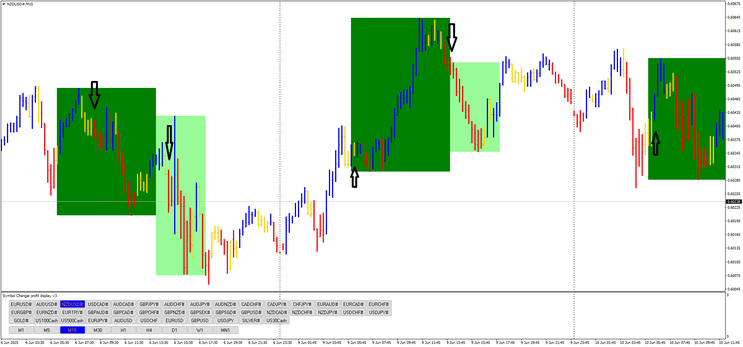
📈 3. Trade Entry Rules
Only look for trade setups within the first 30–90 minutes after a session opens.
✅ Long Trade (Buy) Setup
-
Bar colors change in this sequence:
🔴 Red → 🟡 Gold → 🔵 Blue -
There is no major resistance nearby
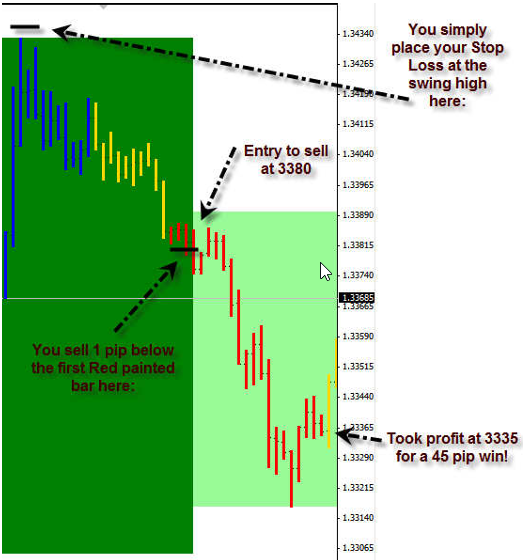
✅ Short Trade (Sell) Setup
-
Bar colors change in this sequence:
🔵 Blue → 🟡 Gold → 🔴 Red -
There is no major support nearby
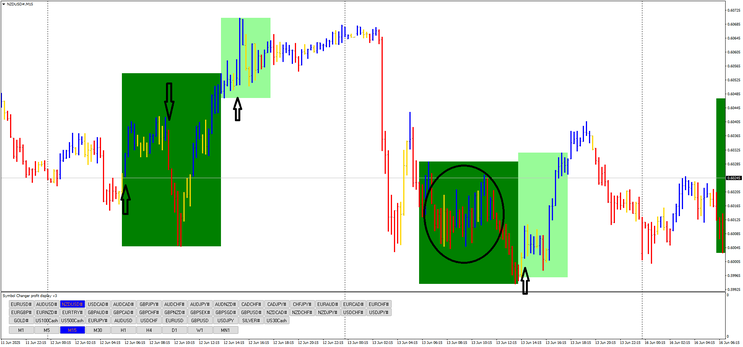
⚠️ High-Risk Entries
-
A quick color change like 🔵 → 🔴 or 🔴 → 🔵 (skipping Gold)
-
Indicates a sudden trend shift — tradable but riskier
4. Stop Loss Placement
-
For Short Trades → Place SL a few pips above the most recent swing high
-
For Long Trades → Place SL a few pips below the most recent swing low
5. Take Profit (TP) Options
Although not detailed in the original rules, consider:
-
Fixed TP using a 2:1 reward-to-risk ratio
-
Trailing stop to secure profits as price moves
6. Trade Example
US Session (starts 8:00 AM EST):
-
At 8:15 AM, bars change from 🔴 → 🟡 → 🔵
No resistance nearby
Enter Long Trade
Place SL below recent swing low
Set TP using R:R or a trailing stop
Pre-Trade Checklist
|
Criteria |
Confirm |
|---|---|
|
Correct trading session |
✅ / ❌ |
|
Entry within first 30–90 minutes |
✅ / ❌ |
|
Valid 3-color sequence (with Gold) |
✅ / ❌ |
|
No major support/resistance nearby |
✅ / ❌ |
|
Stop loss placed correctly |
✅ / ❌ |
|
Proper risk management |
✅ / ❌ |
In rare cases where the sequence is not clear you can refer to the Bollinger Bands Stop indicator attached in the download folder. Happy Trading this is a winning strategy.

195# Auslanco
Auslanco Forex Trading System
Submit by Joy22 (Written Auslanco)
Time Frame 15 min (Intra-day Trading System)
Currency pair: GBP/JPY
a).Simple Moving Average 5 close
b).Gann Hi Low Activator 10
c).Level stop Reverse version 2
Values : ATR Periods 9
ATR Multiplier 3
d).QQE alert
Values: Smoothing Factor 60
Long Entry: Wait for the two buy alerts.(Green arrow and Blue dot). Buy when the price hits 5 SMA after the two signals.
Short Entry: Viceversa.
Stop Loss:Right below the confirmation bar on the Gann Hi low Activator line.
Take profit: Calculate the distance between OPEN price of the confirmation bar and the price of the Gann Hi low Activator(TFT line) at that point and multiply it by 2.
(twice as your stoploss )
My TP targets are as follows and an example of lot allocation(total lots 5):
1st TP: 2 X Stoploss (4-Lots)
2nd TP: Reverse signal confirmation(1-Lot)
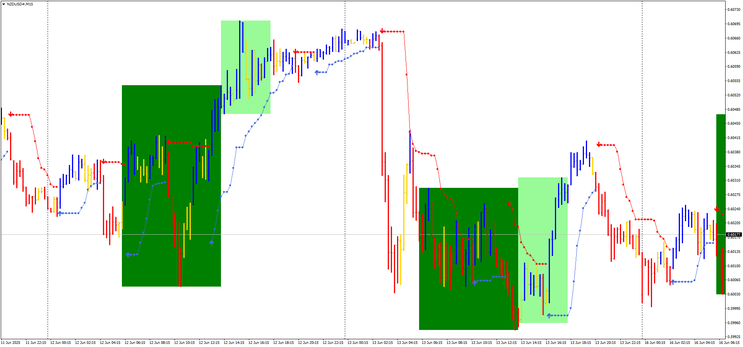
In the pictures Auslanco forex system in action.


-
#1
Is there any new update...
I notice the dot indicator not available there or not appear on chart when I use it now
Any help please
Thanks
