283# Trend Direction Force with Bollinger Bands Stop
Maximo Trader 2025
The Trend Direction Force with Bollinger Bands Stop is a trend momentum forex strategy that combines two highly reliable
tools: Bollinger Bands
Stop, which defines the active trend and its dynamic support/resistance, and
Trend Direction &
Force, which measures real momentum behind each move.
By synchronizing these indicators, the strategy helps traders enter only when trend and force align, capturing clean
directional waves while avoiding noisy consolidation phases. Designed for volatile pairs and timeframes from 3 minutes upward, this approach seeks to balance precision and risk, offering disciplined entries, clear exits, and well-structured risk management.
1. Indicators & Settings (MT4)
A. Bollinger Bands Stop (BB-Stop)
-
Period: 15
Deviation: 3
Line color:
-
Green = bullish bias
Orange/Red = bearish bias
Money Risk: 0.5 (you may adjust depending on TF or volatility)
-
B. Trend Direction & Force (TDFI or TDI Force type)
-
Default settings
Green histogram bars = bullish pressure
Magenta histogram bars = bearish pressure
White/grey signal line = balance level
Zero line serves as momentum confirmation.
2. Core Logic of the Strategy
You only trade when BB-Stop trend direction AND
Trend Direction &
Force agree.
You may open a maximum of 2 trades in the
same direction (scaling in only when conditions are perfect).
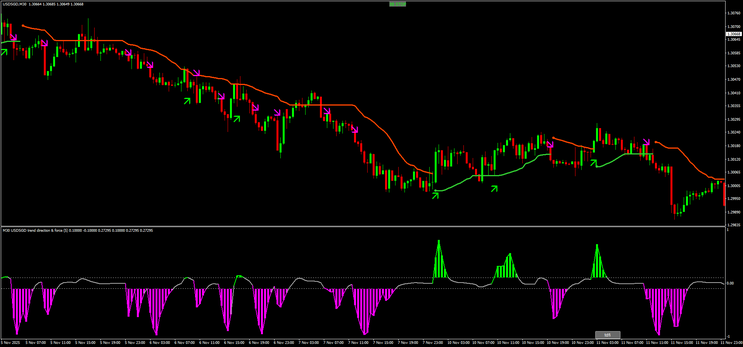
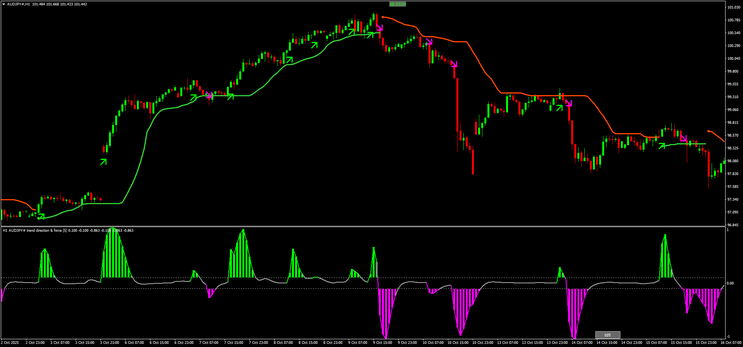
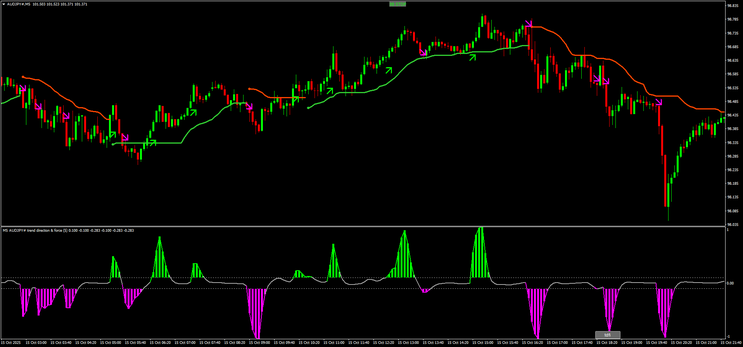
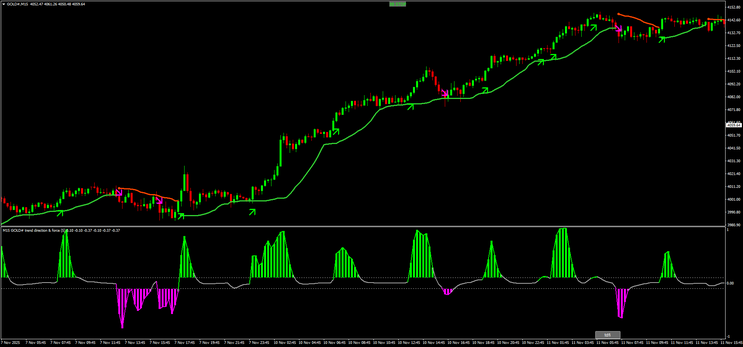
The strategy aims to catch strong directional impulses, visible in your screenshots:
-
Price riding above the green BB-Stop and TDFI showing strong green bars.
Price falling below the orange BB-Stop and TDFI showing magenta bars.
-
3. Buy Rules (Long Trades)
Open a buy when all conditions below align simultaneously:
1. Trend Confirmation
-
BB-Stop line turns green and shifts below the candles.
2. Momentum Confirmation
-
TDFI histogram turns green above the zero line
or TDFI crosses upward from below zero with increasing green bars (momentum building).
3. Price Behavior Confirmation
-
Price pulls back toward the green BB-Stop line but does NOT close below it.
A bullish candle forms above the green BB-Stop after the pullback.
Optional but strong signal (seen in your charts):
-
A small bullish rejection wick touching the BB-Stop line before continuation.
Entry
-
Enter at the close of the confirming bullish candle.
Stop-Loss
-
Below the green BB-Stop line (1–3 pips or variable depending on volatility).
Take-Profit
Choose one:
-
RR 1:2 or 1:3
-
Exit when BB-Stop turns orange
-
Exit when TDFI loses momentum and histogram collapses.
Maximum 2 long positions
-
Only add (stack) if conditions remain perfect and TDFI expands upward again.
-
4. Sell Rules (Short Trades)
Open a sell when all conditions below align simultaneously:
1. Trend Confirmation
-
BB-Stop line turns orange/red and shifts above the candles.
2. Momentum Confirmation
-
TDFI histogram turns magenta below zero
orTDFI crosses downward with expanding magenta bars.
3. Price Behavior Confirmation
-
Price pulls back toward the orange BB-Stop but does NOT close above it.
A bearish candle forms below the orange BB-Stop after the pullback.
Entry
Enter at the close of the confirming bearish candle.
Stop-Loss
Above the orange BB-Stop line.
Take-Profit
Choose one:
-
RR 1:2 or 1:3
-
Exit when BB-Stop turns green
-
Exit when TDFI momentum collapses.
Maximum 2 short positions
-
Only add another trade if momentum increases and TDFI expands lower again.
5. Avoid Trading When
-
TDFI oscillates near zero with no strong green/magenta bars (flat momentum).
BB-Stop flips color repeatedly (choppy market).
Price is stuck inside a tight range of small candles.
High-impact news in the next 10 minutes (for 3m–15m timeframes).
6. Recommended Markets
-
Gold
AUDJPY / GBPJPY / USDJPY
NASDAQ / DAX
BTCUSD (higher TF)
These pairs match the volatility structure shown in your screenshots.
7. Summary
Buy when
BB-Stop green
TDFI green
Price bounces on green BB-Stop
TP when TDFI weakens or BB-Stop flips color.
Sell when
BB-Stop orange
TDFI magenta
Price bounces downward from orange BB-Stop
TP when TDFI weakens or BB-Stop flips color.
Max 2 trades per direction.
283# NonLagMa Trading System
NonLAGMA and MACD
Submit by Joy22 12/01/2012
Time Frame 4H or Daily
Currency Pairs:all
Indicators:
NonLagMA 40 filter 0.5
MACD (12,26,9)
ENTRY RULES
Long Entry
Enter a LONG position when all following conditions are met
- NonLagMA is GREEN and pointing up
- MACD has the GREEN line cuts above the MAGENTA line
Stop loss
Stop loss is set at 50-70 pip on 4-H timeframe or 90-120 pips on Daily timeframe
Exit
Exit LONG position when either the NonLagMa changes its color or MACD
Indicator has the green line cuts below the magenta line
Short Entry
Enter a SHORT position when all following conditions are met
- NonLagMa indicator is GREEN and pointing up
- MACD Indicator has the GREEN line cuts below the MAGENTA line
Stop loss
Stop loss is set at 50-70 pip on 4-H timeframe or 90-120 pips on Daily timeframe
Exit
Exit LONG position when either the NonLagMa changes its color or MACD
Indicator has the green line cuts above the magenta line
In the pictures NonLagaMa forex system in action.