


234# TRI - Smart Zones Indicator v2.1 -TradingView- Complete Trading Guide
Maximo Trader 2025
The TRI - Smart Zones Indicator v2.1 is a professional institutional-grade technical analysis tool designed for TradingView's Pine Script platform. This advanced indicator combines multiple analytical approaches to identify high-probability trading opportunities through automated zone detection, probability-based signal generation, and comprehensive market structure analysis.
Core Features
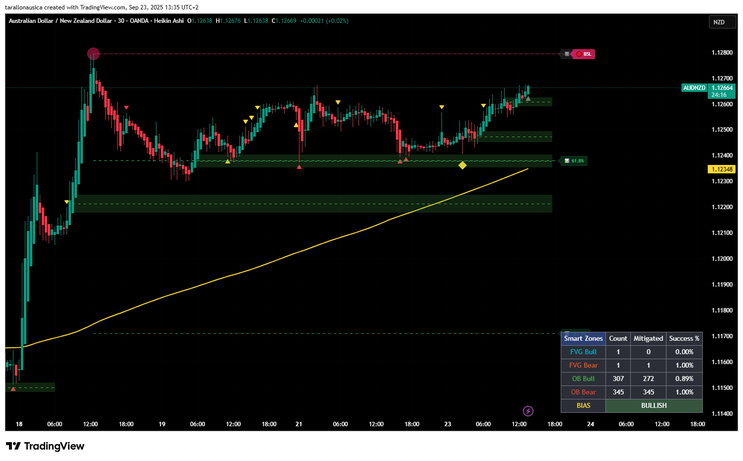
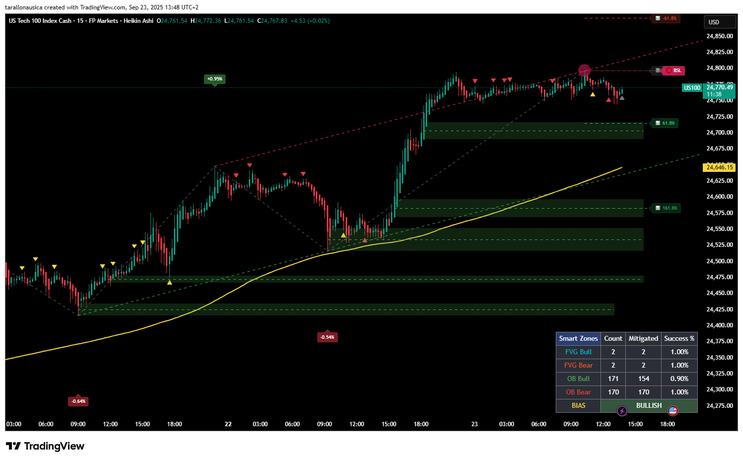
Zone Detection System
The indicator automatically identifies and visualizes two primary types of institutional trading zones:
Fair Value Gaps (FVG): These represent price imbalances where institutional traders have created gaps in the market structure. The indicator detects both bullish and bearish FVGs based on three-candle patterns where price jumps leave unfilled areas. Users can customize the threshold percentage (default 0.1%) to filter for significant gaps only.
Order Blocks (OB): These zones identify areas where smart money has accumulated or distributed positions. The indicator uses volume pivot analysis combined with swing high/low detection to locate these institutional footprints. Order blocks are displayed with customizable extensions and include midline references for precise entry planning.
Advanced Probability Signal System
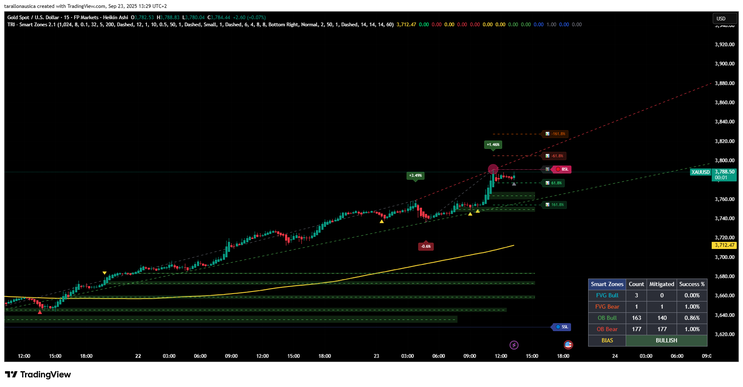
The indicator's flagship feature is its multi-factor probability analysis engine that evaluates 13 distinct market factors to generate color-coded signals:
RED Triangles (80-100% probability): These represent the highest confidence institutional-grade setups where multiple factors align favorably.
YELLOW Triangles (65-79% probability): Professional-grade opportunities with good probability of success but slightly less confluence than red signals.
GREEN Triangles (50-64% probability): Conservative entry points suitable for risk-averse traders or as confirmation signals.
The triangle direction indicates expected price movement: upward-pointing triangles below price bars suggest bounces up from zones, while downward-pointing triangles above bars indicate potential bounces down.
Real-Time Market Direction Indicator
A unique feature of this indicator is its current bar analysis system that provides real-time directional bias:
BLUE Triangles: Indicate the expected direction for the current bar when probability exceeds the user-defined threshold.
GRAY Triangles: Show directional bias when probability is below the threshold, serving as low-confidence signals.
This system includes fallback logic that uses RSI and SMA200 analysis when no active zones are present, ensuring traders always have directional guidance.
Technical Analysis Engine
Multi-Factor Scoring System
The indicator analyzes 13 distinct factors with weighted importance:
-
RSI Analysis (25% weight): Evaluates overbought/oversold conditions and momentum reversals
-
ADX Strength (20% weight): Measures trend strength to determine bounce vs. breakout probability
-
Volume Analysis (15% weight): Assesses institutional participation through volume ratios
-
Volatility Filter (15% weight): Uses ATR analysis to gauge market conditions
-
Candlestick Patterns (15% weight): Identifies reversal patterns like doji, hammer, and engulfing candles
-
MACD Momentum (10% weight): Analyzes directional bias and momentum changes
-
Multi-Timeframe Analysis (10% weight): Incorporates higher timeframe RSI and trend data
-
Price Action Context (8% weight): Evaluates position within recent trading ranges
-
SMA200 Distance (7% weight): Measures proximity to key institutional trend line
Additional factors include zone quality assessment, key level proximity analysis, and historical performance tracking.
Market Structure Analysis
The indicator includes comprehensive market structure visualization through:
ZigZag Analysis: Automatically drawn trend lines with configurable depth and deviation settings. Percentage variation labels show the magnitude of each swing, helping traders understand market rhythm.
Fibonacci Extensions: Multi-level retracement and extension analysis based on the most recent three pivot points. Customizable levels include standard ratios (23.6%, 38.2%, 61.8%) and extended projections up to 361.8%.
BSL/SSL Liquidity Levels: Buy Side Liquidity and Sell Side Liquidity detection based on swing highs and lows within a configurable lookback period. The indicator prioritizes levels that coincide with Order Block zones for enhanced accuracy.
Signal Types and Usage
Probability-Based Signals
The primary signal system focuses on zone interactions with probability-weighted recommendations:
-
Monitor RED probability triangles for highest-confidence entries
-
Use YELLOW signals as secondary confirmation or in trending markets
-
Consider GREEN signals only with additional confluence factors
-
Pay attention to triangle direction for expected bounce or continuation
Legacy Bounce Signals
The indicator also provides traditional Order Block bounce signals with specific criteria:
Green Triangles: Bullish OB contact combined with RSI oversold conditions, strong trend (ADX >25), and favorable MACD alignment.
Red Triangles: Bearish OB contact with RSI overbought readings, trend strength confirmation, and bearish momentum alignment.
Yellow Diamonds: SMA200 retracement opportunities with momentum confirmation, ideal for trend-following strategies.
Current Bar Indicators
The real-time directional system helps with immediate decision-making:
-
BLUE triangles on the current bar indicate good probability for the suggested direction
-
GRAY triangles suggest lower confidence but still provide directional bias
-
These signals update in real-time and are visible only on the most recent bar
Configuration and Customization
Zone Detection Settings
Users can fine-tune zone detection through multiple parameter groups:
-
FVG Settings: Threshold percentage for gap significance and extension length
-
Order Block Settings: Volume pivot length, extension distance, and midline styling
-
Maximum Zones: Control resource usage by limiting total zones per type
Visual Customization
The indicator offers extensive visual customization options:
-
Color Schemes: Separate color controls for bullish/bearish FVG and OB zones
-
Transparency Levels: Adjustable opacity for zone backgrounds
-
Line Styles: Solid, dashed, or dotted options for various elements
-
Label Sizes: Multiple size options for different screen resolutions
Technical Parameters
Advanced users can adjust the underlying technical analysis through:
-
RSI Length: Default 14 periods, adjustable for different market conditions
-
ADX Length: Trend strength calculation period
-
ATR Length: Volatility assessment timeframe
-
Probability Threshold: Minimum percentage for signal generation
Alert System
The indicator provides comprehensive alert functionality across multiple categories:
Zone-Specific Alerts
-
Contact Alerts: Notify when price first touches FVG or OB zones
-
Mitigation Alerts: Signal when zones are broken or filled
-
Liquidity Alerts: BSL/SSL breakthrough notifications
Signal-Based Alerts
-
Probability Alerts: High, medium, and low probability signal notifications
-
Bounce Alerts: Traditional OB bounce signal confirmations
-
SMA200 Alerts: Key trend line retracement opportunities
Aggregated Alerts
-
Smart Zone Contact: Combined FVG and OB interaction alerts
-
Smart Zone Mitigation: Zone breakout/breakdown notifications
-
Advanced Signals: High-probability setup confirmations
Trading Applications
Entry Strategies
Zone Bounces: Wait for price contact with zones, then look for probability triangle confirmation in the expected direction. RED triangles offer highest confidence entries.
Zone Mitigation: Use zone breaks as continuation signals, particularly when supported by liquidity breakthrough alerts.
Trend Following: Combine SMA200 diamond signals with probability triangles for trend-continuation trades.
Risk Management
Zone-Based Stops: Place stops beyond the opposite side of contacted zones for logical risk management.
Probability-Based Sizing: Use larger position sizes for RED probability signals, smaller sizes for GREEN signals.
Multi-Timeframe Confirmation: Enable multi-timeframe analysis for additional confluence on major trades.
Market Structure Context
Liquidity Analysis: Monitor BSL/SSL levels for potential reversal zones and breakout targets.
Fibonacci Levels: Use extension levels as profit targets and key resistance/support areas.
ZigZag Structure: Analyze swing patterns to understand market rhythm and potential turning points.
Best Practices
Signal Confirmation
Never rely on a single signal type. The most effective approach combines:
-
Zone contact (FVG or OB)
-
Probability triangle confirmation (preferably RED or YELLOW)
-
Market structure confluence (Fibonacci, liquidity levels)
-
Current bar direction alignment
Timeframe Considerations
The indicator works across all timeframes but consider:
-
Lower timeframes (1-15min): More signals but higher noise
-
Higher timeframes (4H-Daily): Fewer but higher-quality setups
-
Multi-timeframe analysis: Enable for swing trading applications
Market Conditions
The indicator adapts to different market conditions:
-
Trending Markets: Focus on zone mitigation signals and SMA200 retracements
-
Range-bound Markets: Emphasize zone bounce signals with high probability ratings
-
High Volatility: Use ADX filter to avoid false signals during excessive noise
Dashboard and Statistics
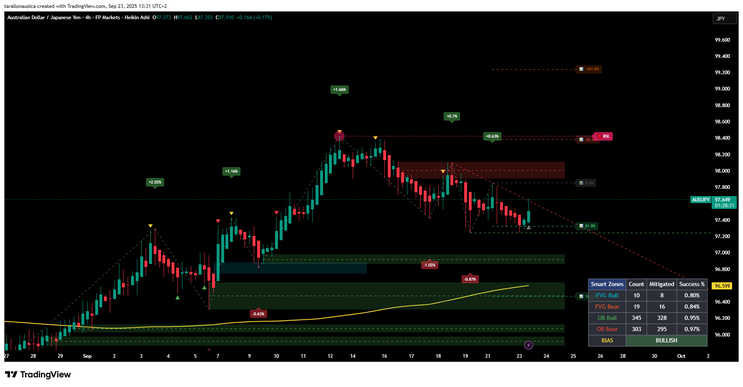
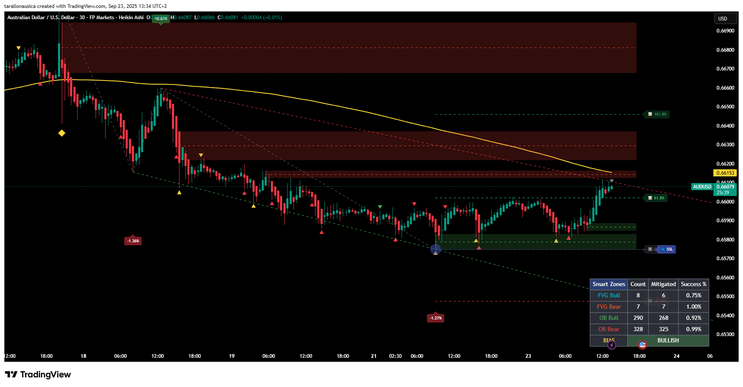
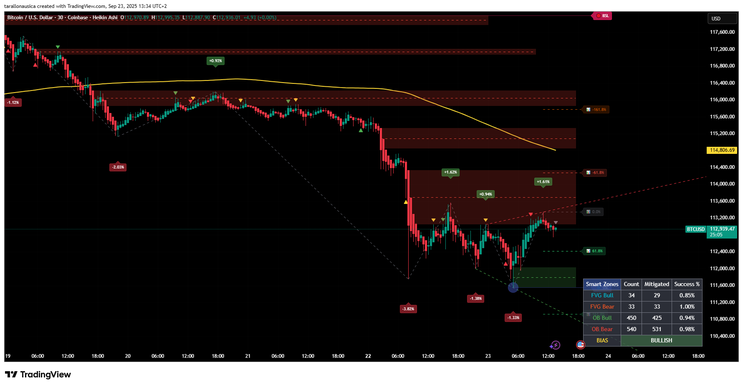
When enabled, the optional dashboard provides valuable performance metrics:
-
Zone Counts: Track total FVG and OB zones created
-
Mitigation Rates: Success rates for different zone types
-
Market Bias: Overall directional tendency based on active zones
This data helps traders understand the current market character and adjust their strategies accordingly.
Conclusion
The TRI - Smart Zones Indicator v2.1 represents a comprehensive approach to institutional-level market analysis. By combining automated zone detection, probability-based signal generation, and extensive market structure analysis, it provides traders with professional-grade tools for identifying high-probability opportunities.
The key to successful implementation lies in understanding the various signal types, using appropriate confirmation methods, and adapting the indicator's extensive customization options to match individual trading styles and market conditions. The multi-factor probability system, in particular, offers a significant advantage by quantifying the likelihood of successful trades based on institutional trading patterns and technical analysis principles.
Regular practice with the indicator's various features, combined with proper risk management and position sizing based on signal strength, can significantly enhance trading performance across various market conditions and timeframes.
ADX Forex Trading System
112#ADX with Stochastic - Forex Strategies - Forex Resources ...
55# ADX filtered SMA 21 - Forex Strategies - Forex Resources ...
69# ADX, Parabolic Sar and three EMA - Forex Strategies - Forex
25# ADX, Awesome and Stochastic Histogramm - Forex Strategies
31# ADX and Moving -Average Channel - Forex Strategies - Forex
18# Emas'Cross and ADX - Forex Strategies - Forex Resources ...
9# Parabolic Sar and ADX - Forex Strategies - Forex Resources ...
21# Slow Stochastic, Mas and ADX - Forex Strategies - Forex ...
ADX Metatrader Indicator - Forex Strategies - Forex Resources ...
75# Awesome, Stochastic and ADX - Forex Strategies - Forex ...
16# Bollinger Bands with ADX, RSI and Two MA - Forex Strategies
15# Bollinger Bands and ADX - Forex Strategies - Forex Resources
80# ADX with MACD II - Forex Strategies - Forex Resources - Forex
182# High Low with Adx - Forex Strategies - Forex Resources ...
10# Bollinger Bands, RSI and ADX - Forex Strategies - Forex ...
37# ADX and EMA - Forex Strategies - Forex Resources - Forex ...
Trend following Forex Strategies

Write a comment