


13# Double Top (Reversal Pattern)

Double Top formation is a distinct chart pattern characterized by a rally to a new high followed by a moderate pullback and a second rally to test the new high. As the stock rallies to make the second peak (top) sellers overwhelm buyers and the stock price collapses. Several weeks later the stock moves to test prior support levels.
The technical target for double tops is derived by subtracting the point difference between the top#1 and the reaction low from the breakout level. After the second top has been created, the breakout level is the reaction low. No double top formation is complete until the stock falls through this level.
• For a valid double top formation it is important that volume decline significantly as the stock moves toward a test of the first top and accelerate as price begins to decline.
• No double top is truly complete until a breakout below the reaction low occurs.
• Downside breakouts often lead to small 2-3% declines followed by an immediate test of the breakout level. If the stock closes above this level (now resistance) for any reason the pattern becomes invalid.
Getting caught in a stock at the high is never much fun but it happens. The double top pattern occurs because most investors that buy a stock "wrong" will refuse to exit until they can do so without suffering a loss. Double tops occur after extended rallies leading to new highs.
As the "story" of the stock becomes more widely accepted investors are willing to pay increasingly exorbitant prices but one day investors find the price is simply too high, the stock puts-in a top and prices begin to fall (top #1). This first top will normally be sufficient to force many of the more speculative investors from the stock. As they sell the price of the stock falls further but many investors will not sell regardless of how far the price falls because they refuse to take a loss.
After several sessions (sometimes weeks) of poor price performance the stock will begin to stabilize (reaction low) then gradually move higher. In most cases this advance will occur because of some fundamental factor like an upcoming analysts meeting, earnings report or stock split. As the stock rises volume slows and investors who bought at the first top get ready to exit positions into further strength.
As the stock approaches the prior high volume surges and new buyers begin to talk about bright fundamental prospects. It is at that moment that all of the investors who purchased positions at the prior high begin selling. Volume surges and the stock soon retreats (top #2). On the chart two equal peaks are created, the double top is in place. In many cases double top formations lead to important declines because two separate sets of investors have been disappointed at a particular level.
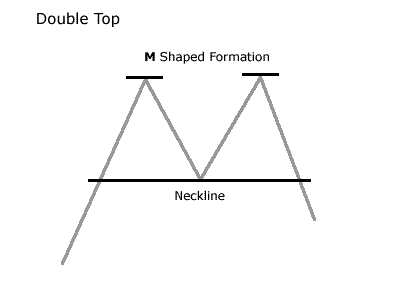
A double top occurs when prices form two distinct peaks on a chart. A double top is only complete, however, when prices decline below the lowest low - the "valley floor" - of the pattern.
The double top is a reversal pattern of an upward trend in a stock's price. The double top marks an uptrend in the process of becoming a downtrend. Sometimes called an "M" formation because of the pattern it creates on the chart, the double top is one of the most frequently seen and common of the patterns. Because they seem to be so easy to identify, the double top should be approached with caution by the investor. Bulkowski estimates the double top has a failure rate of 65%.3 If an investor waits for the breakout, however, the failure rate declines to 17%.
What are the details that I should pay attention to in the double top?
1. Uptrend Preceding Double Top
As mentioned previously, the double top is a reversal formation. It begins with prices in an uptrend. Analysts focus on specific characteristics of that uptrend when searching for a valid double top. The trend upwards should be fairly long and healthy. If the uptrend is short, the double top may not hold and the uptrend will continue.
2. Time between Tops
Analysts pay close attention to the "size" of the pattern - the duration of the interval between the two tops. Generally, the longer the time between the two tops, the more important the pattern as a good reversal. Analysts suggest that investors should look for patterns where at least one month elapses between the peaks. It is not unusual for a few months to pass between the dates of the two tops.
3. Decline from First Top
This element is even more significant to the validity of a double top than volume. He argues the decline in price that occurs between the two peaks should be consequential, amounting to approximately 20% of the price. The deeper the trough between the two tops, the better the performance of the pattern.
4. Volume
Volume tends to be heaviest during the first peak, lighter on the second. It is common to see volume pick up again at the time of breakout.
5. Decisive Breakout
The technical odds usually favor the continuation of the present trend. This means that it is perfectly normal market action for prices on an uptrend to peak at a resistance level a couple of times, retreat, and then resume that uptrend. It is a challenge for the analyst to determine whether the decline from a peak is the indication of the development of a valid double top or simply a temporary setback in the progression of a continuing uptrend. Many experts maintain that an investor should wait for a decisive breakout, confirmed by high volume.
6. Pullback after Breakout
A pullback after the breakout is usual for a double top. Bulkowski argues that the higher the volume on the breakout, the higher the likelihood of a pullback. "When everyone sells their shares soon after a breakout, what is left is an unbalance of buying demand (since the sellers have all sold), so the price rises and pulls back to the confirmation point."

Write a comment