


24# Squeeze Breakout
A Trading Method with Bollinger Bands and Keltner Channels
Submit by Janus Trader 26/08/2013
This Trading Method Sqeeze Breakout was created to trade on stock markets and commodities at the Daily Time Frame. I think that for forex market is good also by 30 min. ime frame.
Time Frame 30 min or higher
Markets:any
The Squeeze Play Breakout is a volatility setup. It actually begins with an unusual lack of volatility for the market that you are trading. In other words, a market is trading with much less volatility than is usually the case judging by the market's historical data. Key point: The Squeeze Play relies on the premise that stocks and indexes fluctuate between periods of high volatility and low volatility. When periods of low volatility occur, a market should eventually revert back to its normal level of volatility. My strategy uses two indicators applied to Daily Bars: The well-known Bollinger Bands and... ...the much less well know Keltner Channels. With both the Bollinger Bands and Keltner Channels, I use the standard default settings that are used on vast majority of trading platforms that I've seen: Bollinger Bands: Length 20, Standard Deviation, 2 Keltner Channels: Length 20. There are two versions of the Keltner Channels that are commonly used. I use the version in which the bands are derived from "Average True Range." When I have looked at how Keltner Channels are configured in different charting programs, I've noticed that there can be some minor variations. You should not only be sure that you're using the formulation that uses Average True Range, but also that the center line is the 20-period Exponential moving average. Okay, let's get into the guts of of both of these indicators so that you'll understand why the combination of these two indicators is so effective.
Bollinger Bands were made famous as a trading tool by John Bollinger in the early 1980s. A Bollinger band tells you the amount of volatility there is a given market relative to the recent past. When a market is very volatile relative to the recent past, the Bollinger band will expand. When a market is going through a period of low volatility relative to the recent past, the Bollinger band will contract
Different parameters in the Bollinger Band can be adjusted such as the period of the simple moving average and the number of standard deviations used. Use parameters that are usually the standard default setting. Bollinger Bands: Length 20, Standard Deviation, 2 Now, the statistical term that you don’t commonly hear in normal conversation is “standard deviation.” Understanding this term is the key to understand how a Bollinger Band detects and displays fluctuations in the degree of volatility. In plain English, standard deviation is determined by how far the current closing price deviates from the mean closing price. The formula for computing standard deviation is rather complex and I’m running the risk of oversimplifying (and offending math Phds) but the general concept is that the farther the closing price is from the average closing price the more volatile a market is deemed to be. And vice versa. That is what determines the degree of contraction or expansion of a Bollinger Band.
At point 1 the Red arrows are indicating a Bollinger Band Squeeze. At point 2 the Red arrows are indicating another Bollinger Band Squeeze. What’s hard about this situation is you do not know how to qualify this squeeze. What we need to do is to quantify how narrow is narrow so that you can determine when a potential trade is triggered. The way we do this is to add the Keltner Channel to the chart.
Bollinger Bands=Blue
Keltner Channel=Red
In chart 2 now that we have the Keltner Channel overlaid on top of what you saw in Chart 1, we can qualify the Squeeze. You only take a squeeze play that meets the following criteria: You only consider taking a squeeze play when both the upper and lower Bollinger Bands go inside the Keltner Channel. Points 1 and 2 show examples of the Bollinger Bands (blue lines) going inside the Keltner Channel (Red lines). At those points, you know the squeeze has started. When the Bollinger Bands (BOTH blue lines) start to come out of the Keltner Channel (red lines) the squeeze has been released and a move is about to take place. Bollinger Bands and Keltner Channels tell you when a market is transitioning from low volatility to high volatilty. Using these two indicators together is a valuable technique in itself and I would imagine that some of you would be able to make use of it. In additional of this 2 super indicators, add momentum + Volumn and apply the knowledge of candlestick will further enchance your power in Squeeze Play Breakout.
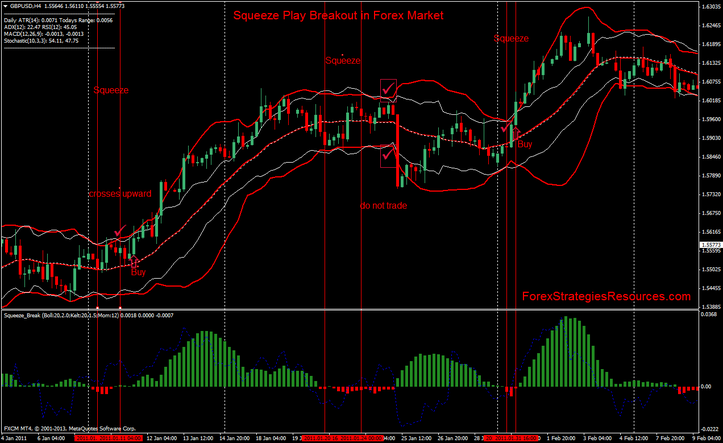
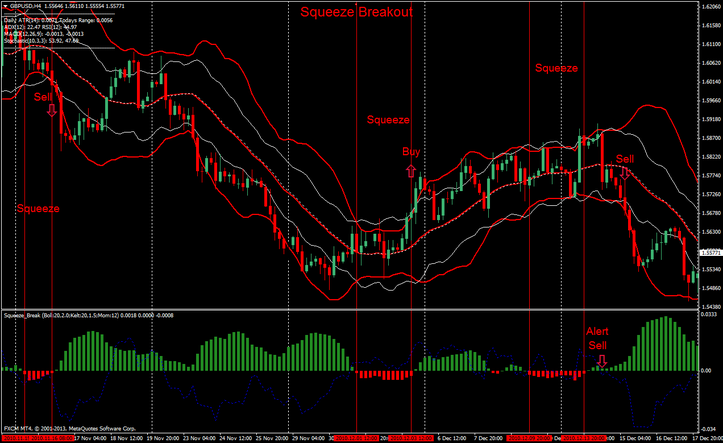
Squeeze Play Breakout in Forex Market
Buy
When a Bollinger Band Squeeze is formed wait that upper Bollinger Band crosses upward upper Keltner Channel and wait that the price broken the upper band for entry long.
Sell
When a Bollinger Band Squeeze is formed wait that lower Bollinger Band
crosses downward lower Keltner Channel and wait the price broken the lower band for entry short.
Squeeze Breakout: Template and indicators
Forex Strategies with Bollinger Bands
Bollinger Bands Forex Strategies
65# Bollinger bands Spike scalping - Forex Strategies - Forex ...
88# Bollinger Bands and RSI Scalping - Forex Strategies - Forex
114# Awesome and Bollinger Bands Scalping - Forex Strategies
16# Bollinger Bands scalp GBP/JPY - Forex Strategies - Forex ...
124# Bollinger Bands Scalping - Forex Strategies - Forex
4# Bollinger Bands, and CCI - Forex Strategies - Forex Resources
8# Bollinger Bands Multitimframe - Forex Strategies - Forex ...
13# Bollinger Bands Bounce - Forex Strategies - Forex Resources
181# Bollinger Bands Stop - Forex Strategies - Forex Resources
188# Bollinger Bands and Stochastic - Forex Strategies - Forex ...
201# T3 Clean and Bollinger Bands - Forex Strategies - Forex ...
337# Bollinger Bands Stop Forex System - Forex Strategies -
32# Inside Bar with Bollinger Bands - Forex Strategies - Forex ...

Write a comment
Emi (Friday, 13 July 2018 10:51)
rawing trend lines is one of the few easy techniques that really WORK. Prices respect a trend line, or break through it resulting in a massive move. Drawing good trend lines is the MOST REWARDING skill.
The problem is, as you may have already experienced, too many false breakouts. You see trend lines everywhere, however not all trend lines should be considered. You have to distinguish between STRONG and WEAK trend lines.
One good guideline is that a strong trend line should have AT LEAST THREE touching points. Trend lines with more than four touching points are MONSTER trend lines and you should be always prepared for the massive breakout!
This sophisticated software automatically draws only the strongest trend lines and recognizes the most reliable chart patterns formed by trend lines...
Chart patterns such as "Triangles, Flags and Wedges" are price formations that will provide you with consistent profits.
Before the age of computing power, the professionals used to analyze every single chart to search for chart patterns. This kind of analysis was very time consuming, but it was worth it. Now it's time to use powerful dedicated computers that will do the job for you:
toi do (Sunday, 04 November 2018 17:13)
https://www.youtube.com/watch?v=hx25iEgrWcU&t=1057s
ooyacu (Wednesday, 13 March 2019 21:13)
Keltner Channel indicator added to this package has something wrong in code