28# Bollinger Bands Overbought and Oversold
Bollinger Bands forex trend trading system
Submit by Mike Trader 21/11/2013
Bollinger Bands are calculated by taking the Standard deviation of a moving average over a given period of time. Used to measure when an financial trading instrument is
Oversold or Overbougth.
Upper band is overbougth, Lower band is Oversold.
Standard formuka is:
2 Standard deviation and 20 period moving average.
In this Bollinger Bands Stategy
look for momentum trend:
1) Buy when the trend is Oversold
Short when the trend is Overbougth
Markets: any.
How to this:
Apply a longer term Moving Average;
Time frame 30 min or higher;
Bollinger Bands (20 periods,2 Standar deviation);
34 Moving average smoothed ;
Stichastic indicator (5,3,3).
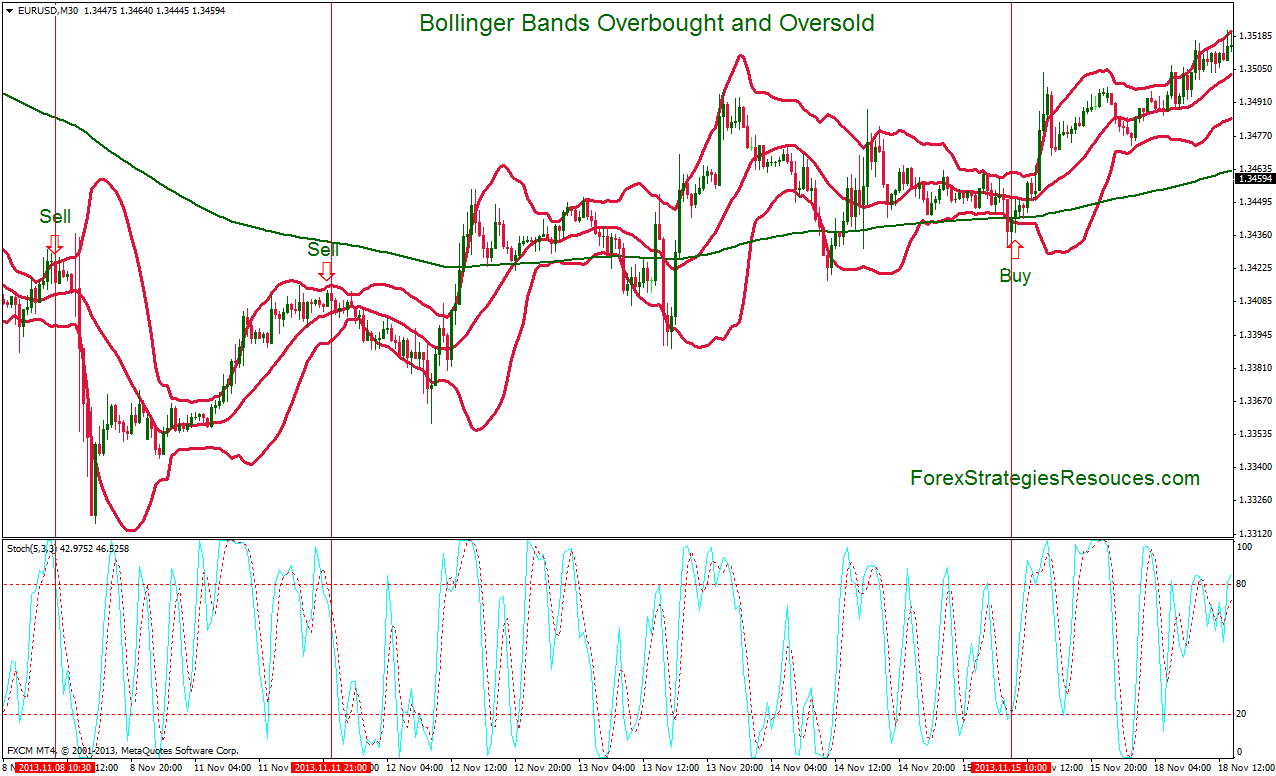
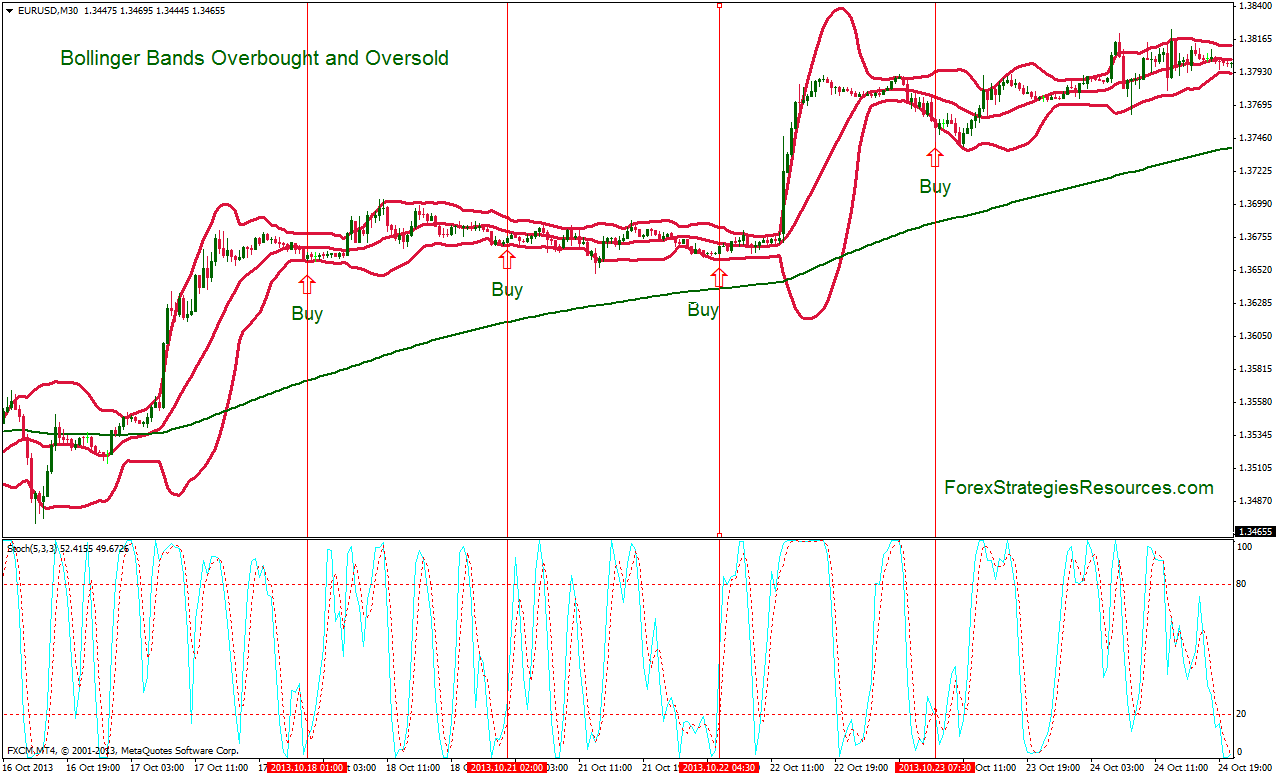
How Bollinger bands Overbought and Oversold forex strategy works
Buy when the price is oversold, Stochastic indicator also in oversold and crosses upward but also above the 34 period moving average smoothed.
Short when the price is overbougth, Stochastic indicator also in overbougth and crosses downwward but also below the 34 period moving average smoothed.
Exit when the position trades back midllle band, at the predetermined profit target,
or exit when the price close a bar below/above the moving average.