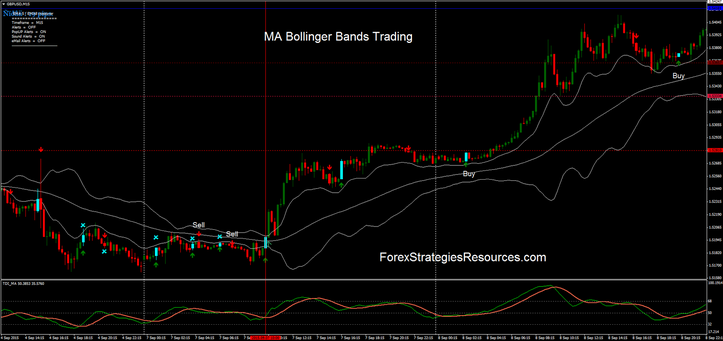
32# MA Bollinger Bands Trading
Trading Reversal and Trending with Bollinger Bands
Submit by Lucky 11/09/2015
MA Bollinger Bands Trading is a reversal and trending strategy with strenght-momentum filter. This strategy works at all time frame from 15 min tf. For conservative approach you can use this trading system also only in trending market.
Time Frame 15min or higher.
Financial Markets: Forex, Indices, Commodities.
Metatrader Indicators:
EMA 9 (yellow line),
Bollinger Bands ( 5 period, 1,5 deviations),
Signal arrows alerts,
EMA Crossover (5, 8),
MA crossover Candles ( 5, 8),
TDI (fast setting),
MA Bollinger Bands,
Fibonacci pivots for intraday trading as profit target.
Rules for MA Bollinger Bands Trading
for entry we have two signals alerts.
Buy
Arrow buy confirmed by:
MA 9 above lower band of the BB and TDI (fast crossing upward).
Sell
Arrow sell confirmed by:
MA 9 below upper band of the BB and TDI (fast crossing downward).
Exit position with ratio stop loss 1.2.
place initial stop loss on the previous high/low swing.
This trading system is very impressive.
In the pictures MA Bollinger Bands Trading in action.
MA Bollinger Bands


Write a comment
Robert (Saturday, 12 September 2015 15:55)
Excellent System !
A clarification , please : you said " Arrow buy ( or Sell ) confirmed by " , but WHAT Arrow Buy ? Ema crossover OR Signal H1 arrows ?
And what is the function of "MA crossover signal candles " indicator ?
Thanks for kind replay .
Robert (Saturday, 12 September 2015 19:19)
Excellent System !
A clarification , please :
You said " Arrow buy ( or Sell ) confirmed by " , but WHAT Arrow Buy ? Ema crossover or Signal H1 arrows ?
And what is the function of "MA crossover signal candles " ?
Thanks for kind replay .
Robert (Sunday, 13 September 2015 13:08)
Excellent System !
A clarification , please :
You said " Arrow buy ( or Sell ) confirmed by " , but WHAT Arrow Buy ? Ema crossover or Signal H1 arrows ?
And what is the function of "MA crossover signal candles " ?
Thanks for kind replay .
Anthony (Wednesday, 02 December 2015 13:37)
You meant to say "1.5 deviations", not "15 deviations", I think, for the Bollinger Bands? 15 deviations would put the upper and lower bands well off the chart, to put it mildly! ;)