


10# Rising Wedge (Continuation Pattern)
Rising Wedge in a downtrend is a
decline to a new low on strong volume,
several weeks of narrowing, rangebound
trade characterized by higher
highs and higher lows with contracting
volume, followed by a sharp break
lower on strong volume.
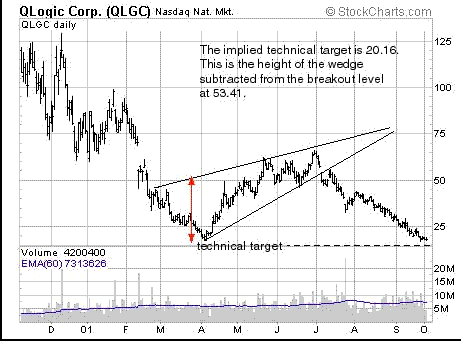
Technical targets for rising wedges
are derived by subtracting the height of
the pattern from the eventual breakout
level. The breakout level is the lower
Rising wedges can be either reversal or continuation patterns. When they occur in a downtrend they are always continuation patterns.
• Although the news that is pushing the stock higher may be bullish, weak volume is an indication that professionals are not buying, indeed, these investors are using strength to unwind existing long positions and/or establish new short positions.
• Rising wedge formations in downtrends are distributive in nature. The fact that price is rising but volume is declining is a good indication that the move higher is illegitimate.
• Downside breakouts often lead to small 2-3% declines followed by an immediate test ofthe breakout level. If the stock closes above this level (now resistance) for any reason the pattern becomes invalid.
Rising wedge formations in downtrends are very similar to other triangle patterns in that they are characterized by narrowing price ranges and slowing volume. Unlike symmetrical and right angle triangles, rising wedge formations in downtrends almost always result in large price declines. Many bearish technical patterns are about deception and this is particularly true for the rising wedge. Because this pattern features gradually higher stock prices many investors will jump to the incorrect conclusion that the stock is acting well from a technical perspective.
This is false. Although prices continue to rise, every rally is more feeble than the last and it soon becomes clear that interest in owning the stock at higher prices is waning.
The first point in every rising wedge in a downtrend formation begins with a relative new low. This low is generally in response to a series of negative fundamental developments. The stock may have had an earnings warning, product delay or
litigation setback but the story behind the price weakness is always legitimate and leads to a real change in the way the stock is perceived. What makes the pattern interesting is that like many reversal patterns, the decline to relative new lows
actually leads to what appears to be aggressive buying by large investors. This turn of events creates a short term bottom
(a).
Encouraged by the show of strength at point (a), selling pressures begin to wane and over the next several days the stock begins to move higher. Volume is light but it soon becomes clear the panic that lead to the recent relative new low has been
replaced by more rational thinking. Wall Street brokers begin to make more positive comments and volume increases modestly. This increase in volume should lead to further gains but instead sellers step-up and what looks like a reaction
high occurs, point (b).
On continued light volume the stock drifts lower but to the great delight of those looking for a near term bottom, the move lower does not eclipse the lows set at point (a) and a new rally begins. This point, (c), plays an important role in investor
sentiment because it appears as though the stock is making a series of higher lows.
Speculators begin adding new long positions in anticipation of a much bigger rally -- and for a short time they are rewarded. Amid more optimistic comments from Wall Street analysts the stock rises beyond the level of point (b) but not
high enough to create a parallelogram with the lows. This is a defining point in time because it sets the wedge formation characterized by a narrowing price range. After several additional sessions the stock stops rising and a new short term top
becomes evident, point (d).
At this point a new, negative fundamental development occurs and the stock begins to decline. Speculators rush to close long positions to avoid losses but buyers are few. The imbalance between motivated sellers and willing buyers leads to a watershed decline. This situation is made worse by a series of negative comments from Wall Street analyst in the days ahead. Weeks later the stock declines to a new low.
