


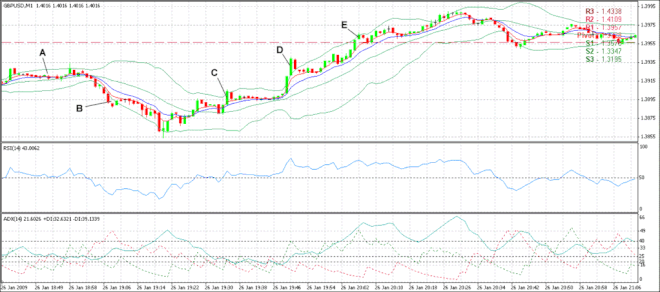
The chart above is our 1 minute chart. At Point A the market was in
consolidation. As you can see the upper and lower Bollinger Bands had
contracted so we would have been looking for the bands to start expanding from
this point onwards.
At Point B the Bollinger Bands had started to expand and we did have a
breakout, but to the short side. We determined that the trend on the 4 hour chart
was up so even though we had a valid breakout to the short side on the 1 minute
chart we did not enter a trade.
We will continue to wait until the Bollinger Bands expand again and we have a
breakout to the long side. At Point C the bands were expanding and we had a
close above the upper Bollinger Band so we placed an entry order 2 pips above
the high of this candle.
We then placed a target limit 20 pips above this candle. As you can see it was a
while before our order was opened but once it was opened it did not take long for
our target to be reached.
At Point D our target had just been taken and we had another breakout of the
upper Bollinger Band which was a signal to enter the market so we placed an
entry order 2 pips above this candle with a target limit of 20 pips.
The order was filled and the target achieved not long after placing the order and
we had another breakout and entry signal at Point E. We placed an entry order 2
pips above the high of the candle with a target limit of 20 pips and within a few
minutes the order was opened. Shortly after that the target limit was reached.
So we placed 3 orders and made 20 pips on each but there was more to come,
have a look at the following chart:
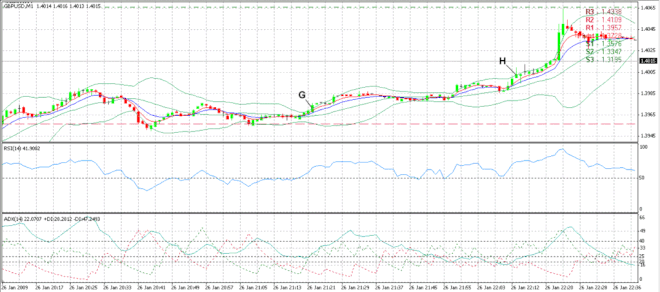
After our last order closed for a profit the market consolidated for a bit so we
stayed out, but at Point G we had another entry signal and we placed an entry
order 2 pips above this bar with a target at 20 pips, which we eventually
achieved.
Later on at Point H we had another breakout of the upper Bollinger Band so we
placed another entry order 2 pips above the high of this bar with a 20 pip target
which was reached in no time.
While we entered these positions on the 1 minute chart we kept an eye on the 5
minute, 15 minute, 30 minute and 1 hour charts as well as looking for possible
entries. During the uptrend we had a few entry signals on these time frames as
well. Have a look at the following chart:
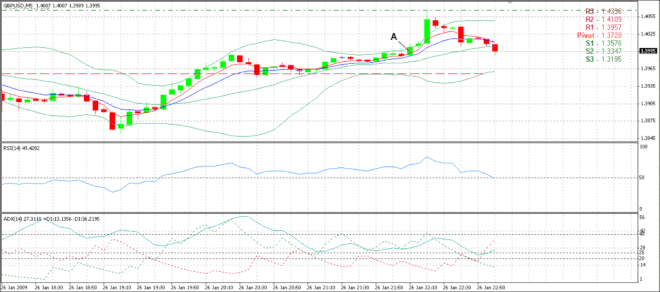
At point A on the 5 minute chart above, there was a breakout of the upper
Bollinger Band as the bands were starting to expand, so we placed an entry
order 2 pips above the high of this candle with a target of 30 pips.
The order was opened on the next candle and the target was easily achieved by
the time the next candle had closed.
So while you’re trading the 1 minute chart it is a good idea to keep an eye on
what’s going on with the other time frames because signals will appear on these
time frames as well.
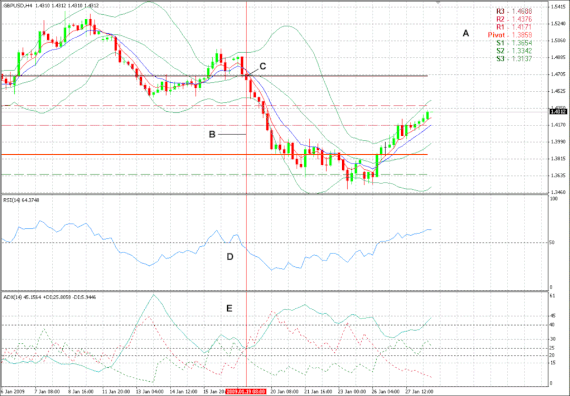
Short Trade Example:
Have a look at the following chart. This is a 4 hour chart of the GBPUSD pair. At
Point A you can see I have added my Pivot levels.
At Point B the market turned bearish. The 5 EMA crosses below the 10 EMA at
Point C. The RSI is below the 50 line at Point D.
At Point E the -DI line has just moved above the +DI line with the ADX above 25
which tells us that the trend is DOWN so we will be now be switching to our one
minute chart where we will be looking for opportunities to SELL.
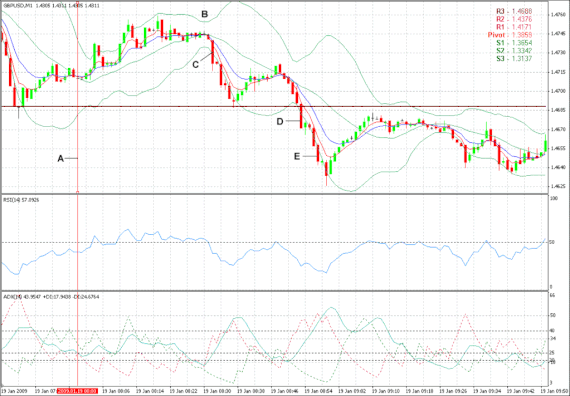
Have a look at the 1 Minute chart below. Point A is the area at which the trend
had turned bearish on our 4 hour chart. As you can see at Point B, the Bollinger
Bands had started to contract, so we would have been looking for expansion of
the bands and a breakout from that point onwards.
At Point C the Bollinger Bands had already started to expand and we had our
first breakout of the lower band so we placed a Sell entry order with a 20 pip
profit target 2 pips below the low of this candle.
The order was opened and the target achieved within a few bars before the
market started to retrace.
At Point D we got another entry signal. The Bollinger Bands were still expanding
and we had a breakout of the lower band at this point so we placed a Sell entry
order with a 20 pip profit target 2 pips below the low of this candle.
Again the order was opened and the target achieved easily before we received
another entry signal at point E. The Bollinger Bands continued expanding and we
had a breakout of the lower band at this point so we placed a Sell entry order
with a 20 pip profit target 2 pips below the low of this candle.
The order was opened and the target was easily achieved within a few bars. At
this point setup signals were yet to form on the other time frames we were
monitoring and while we did not make any trades on these time frames in this
example, we still monitored these charts from time to time looking for a valid
setup and an opportunity to go short.
Remember that this system does not use a stop loss and there will be times
when the market goes against you. When trading this system there were
occasions when the market went against us as much as 200 pips, but it did
eventually come back in our direction and our targets were achieved.
If you find the market has gone in the opposite direction it is best to exit the trade
for a small loss as opposed to letting the market go further against you. Each
trader has a different level of risk that they are comfortable with so it’s best that
you decide before hand how far you will let the market go against you before
deciding to close the order.
If you decide that 100 pips is acceptable for you then you could set a stop loss or
trailing stop every time you place a trade or monitor the trade and close the
position manually when it goes 100 pips against you.
We highly recommend that you use some kind of risk management. Whatever
you decide to set your stop loss at will be entirely up to you.

Bollinger Bands Forex Strategies
65# Bollinger bands Spike scalping - Forex Strategies - Forex ...
6# Bollinger Bands Reversal - Forex Strategies - Forex Resources
88# Bollinger Bands and RSI Scalping - Forex Strategies - Forex
114# Awesome and Bollinger Bands Scalping - Forex Strategies
16# Bollinger Bands scalp GBP/JPY - Forex Strategies - Forex ...
4# Bollinger Bands, and CCI - Forex Strategies - Forex Resources
7# Bollinger Bands Trend - Forex Strategies - Forex Resources ...
14# Bollinger Bands, RsI And Stochastic - Forex Strategies -
13# Bollinger Bands Bounce - Forex Strategies - Forex Resources
188# Bollinger Bands and Stochastic - Forex Strategies - Forex ...
17# Bollinger Bands and Equidistant Channel - Forex Strategies ...
18# Bollinger Bands and RSI Divergence - Forex Strategies -
15# Bollinger Bands and ADX - Forex Strategies - Forex
12# Bollinger Bands and Fibonacci Retracement - Forex
16# Bollinger Bands with ADX, RSI and Two MA - Forex
11# Bollinger Bands Breakout and RSI - Forex Strategies - Forex
181# Bollinger Bands Stop - Forex Strategies - Forex Resources
33# Pin Bar, Bollinger Bands and Jma Starlight - Forex Strategies
57# Scalping with Money Flow Index and Bollinger Bands - Forex
55# Bollinger Bands Exit System - Forex Strategies - Forex ...
80# Starc Bands with Bollinger Bands - Forex Strategies - Forex
152# Bollinger Band Scalping - Forex Strategies - Forex
Bollinger Bands Metatrader Indicator - Forex Strategies - Forex ...

Write a comment