


8# Double Bollinger Bands Scalping Strategy
A Professional Guide to Trading with Gold Scalper V4.1 -TradingView-
Joy22 2026
Bollinger Bands. When used in a double-band configuration and combined with multi-timeframe analysis, they become a remarkably effective framework for identifying high-probability reversal setups. The Gold Scalper V4.1 indicator is built around this concept and transforms it into a complete trading system.
Originally designed for gold, this indicator performs exceptionally well across a wide range of liquid markets, including forex pairs, stock indices, and cryptocurrencies. Its strength lies in its ability to highlight statistically extreme price conditions, filter signals using a higher timeframe trend, and automatically display entry, stop loss, and take profit levels.

Understanding the Logic Behind the Indicator
Markets move in cycles. Periods of expansion are followed by contractions, and strong directional moves often lead to temporary overextensions before price reverts toward its average value. Gold Scalper V4.1 is designed to detect these moments of excess.
The indicator uses two sets of Bollinger Bands on the current timeframe. The inner bands, known as BB1, are calculated at one standard deviation and represent the normal trading range. The outer bands, BB2, are calculated at two standard deviations and identify statistically extreme areas where price is considered overbought or oversold.
To improve signal quality, the indicator also plots Bollinger Bands from a higher timeframe. This additional layer provides directional context and helps traders align their entries with the broader market structure.
The Three Market Zones
The visual structure of the indicator is divided into three distinct zones.
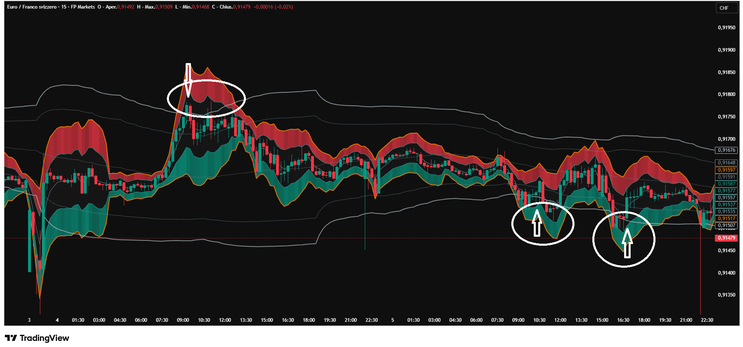
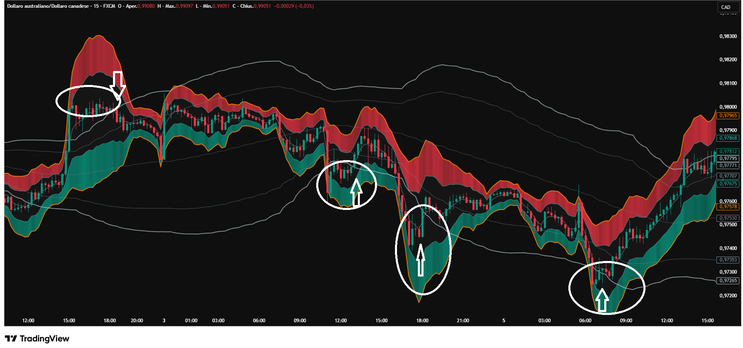
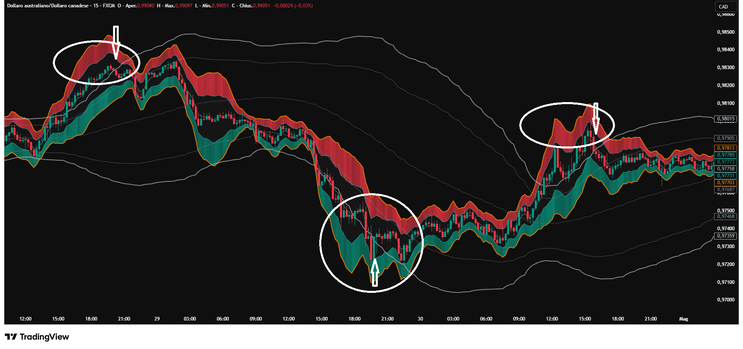
The green area, located between the lower BB1 and lower BB2 bands, is the BUY ZONE. When price enters this region, the market is considered oversold, and traders begin looking for long opportunities.
The gray central area, between the upper and lower BB1 bands, is the NEUTRAL ZONE. This represents fair value, where price is neither stretched nor compressed. In this zone, the market offers little statistical edge.
The red area, located between the upper BB1 and upper BB2 bands, is the SELL ZONE. When price moves into this region, the market is considered overbought, and traders begin looking for short opportunities.
How to Read the Chart
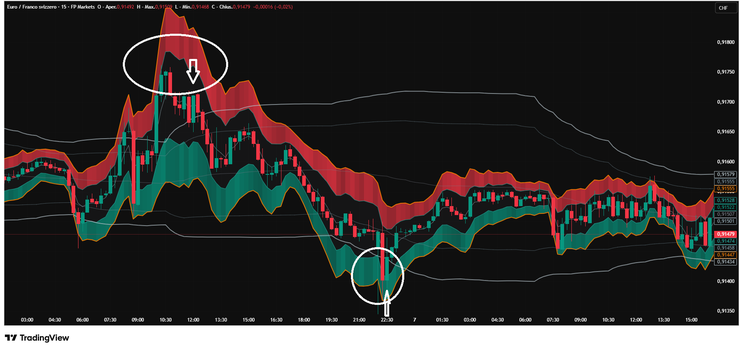
Consider the example shown on the CHFJPY 15-minute chart. Price trends upward for several hours and eventually enters the red SELL ZONE. It pushes above the upper BB2 band, signaling an overextended move. Shortly afterward, a strong bearish candle appears, and the indicator highlights the area as a potential short setup.
This sequence illustrates the core principle of the strategy: identify statistically extreme moves and trade the subsequent reversion toward the mean.
Buy Setup Rules
A long trade is considered when price closes below the lower BB2 band, indicating a significant oversold condition. The setup becomes valid when the lower band begins to turn upward, suggesting that downward momentum is weakening. At the same time, price should remain above the higher timeframe basis line, confirming that the broader trend is bullish.
Once all conditions are satisfied, the indicator generates a BUY signal and automatically plots the suggested entry price, stop loss, and profit targets.
The stop loss is placed slightly below the lower BB2 band. The first target is the upper BB1 band, while the second target is the upper BB2 band.
Sell Setup Rules
A short trade is considered when price closes above the upper BB2 band, indicating an overbought condition. The setup becomes valid when the upper band begins to flatten or turn downward, signaling that bullish momentum is losing strength. Price should also be below the higher timeframe basis line, confirming a bearish broader trend.
When these conditions align, the indicator generates a SELL signal.
The stop loss is placed slightly above the upper BB2 band. The first target is the lower BB1 band, and the second target is the lower BB2 band.
The Importance of Higher Timeframe Confirmation
One of the most valuable features of Gold Scalper V4.1 is its higher timeframe filter. This component prevents traders from taking reversal setups that go directly against the dominant trend.
For example, on a 15-minute chart, the indicator may use a 1-hour higher timeframe. If price is trading above the higher timeframe basis, only long setups are favored. If price is below that basis, only short setups are considered.
This simple filter dramatically improves signal quality by aligning trades with broader market sentiment.
Momentum and Band Slope Analysis
Price can remain overbought or oversold for extended periods, particularly during strong trends. For this reason, the indicator does not trigger a signal immediately when price touches the outer bands.
Instead, it waits for the outer band to lose momentum. In practice, this means the upper BB2 band must begin to flatten or slope downward for sell setups, while the lower BB2 band must begin to flatten or slope upward for buy setups.
This additional condition helps identify genuine exhaustion rather than temporary acceleration.
Automatic Trade Management
When a valid signal appears, the indicator draws all key levels directly on the chart. The trader immediately sees the entry point, stop loss, TP1, and TP2.
This visual trade plan simplifies execution and removes much of the subjectivity that often leads to poor decision-making.
Example of a Short Trade
Suppose CHFJPY rallies into the SELL ZONE and closes above the upper BB2 band at 201.69. The higher timeframe filter confirms bearish conditions, and the upper band begins to roll over.
The indicator generates a SELL signal.
A possible trade plan could be:
Entry at 201.69.
Stop loss at 202.02.
Take Profit 1 at 201.55.
Take Profit 2 at 201.40.
As price reverts toward the mean, the trade captures the downward movement while maintaining a favorable risk-to-reward ratio.
Risk Management Guidelines
No strategy is complete without proper money management. A prudent approach is to risk between 0.5 percent and 1 percent of account equity per trade.
After the first profit target is reached, many traders move the stop loss to breakeven. This locks in gains while allowing the second target to capture larger moves.
Best Markets and Timeframes
Gold Scalper V4.1 performs best on highly liquid instruments with consistent volatility.
Popular choices include XAUUSD, EURUSD, GBPJPY, CHFJPY, US500, and NASDAQ.
Recommended timeframe combinations are 1 minute with 5 minutes, 5 minutes with 15 minutes, 15 minutes with 1 hour, and 1 hour with 4 hours.
When to Stay Out of the Market
Even the best indicators should not be used blindly. It is wise to avoid trading during major economic announcements, periods of extremely low liquidity, or powerful one-directional trends driven by fundamental catalysts.
In such conditions, price may remain outside the outer Bollinger Bands much longer than expected.
Why This Strategy Works
The effectiveness of the Double Bands Scalping Strategy stems from its combination of statistical analysis, momentum assessment, and higher timeframe confirmation.
It does not attempt to predict the future. Instead, it identifies conditions where price has moved too far, too fast, and where the probability of mean reversion is elevated.
Final Thoughts
Gold Scalper V4.1 is more than a visual indicator. It is a complete trading framework that combines Double Bollinger Bands, trend filtering, and automatic trade management into a coherent and practical strategy.
For traders who prefer objective rules and clearly defined setups, the Double Bands Scalping Strategy offers a disciplined approach to capturing reversals in liquid markets.
Used with patience, sound risk management, and respect for market context, it can become a valuable component of any professional trading methodology.
8# Bollinger Bands Multitimeframe Trading System
Submit by joy22
Time Frame H1 and H4
Pairs:all
Indicators:
Bollinger Bands (2, 20);
Bollinger Bands (3, 20)
Stochastics. (14,3,3.);
Setup
I trade this method using both a 1H and 4H chart. When the price on the 1H chart breaks Bollinger Bands (3) I see that price has broken the inner Bollinger Band level on 4H. Now we can expect a pullback or a ‘reversion of the price.
Long Entry Position:
the price on the 1H chart breaks Bollinger Bands (3);
the price has broken the inner Bollinger Band(2) level on 4H;
the stochastic is in overbought territory ( less than 20),to see before considering a trade is %K crossing %D from below 20 (for a long trade).
Short Entry Position:
the price on the 1H chart breaks Bollinger Bands (3);
the price has broken the inner Bollinger Band(2) level on 4H;
the stochastic is in oversold territory ( greater than 20),to see before considering a trade is %K crossing %D from above 80 (for a long trade).
Exit Position:
1)Stops are placed 5 pips behind the low or high of the entry bar;
2) Trailing Stop;
3) Profit Target: 60 pips EUR/USD, 70 pips GBP/USD 4H Time Frame, for Daily time frame 200pips EUR/USD , 250 pips GBP/USD (recommended);
4) When the price touches the middle or the upper and lower band of BB (20. 2) of 1H chart.
Example on January 28 at 16:00 the price breaks on chart 1H BB (20, 2) and BB (20.3). In chart 4H the price is between H BB (20, 2) and(BB20, 3)


Bollinger Bands Forex Strategies
65# Bollinger bands Spike scalping - Forex Strategies - Forex ...
88# Bollinger Bands and RSI Scalping - Forex Strategies - Forex
114# Awesome and Bollinger Bands Scalping - Forex Strategies
16# Bollinger Bands scalp GBP/JPY - Forex Strategies - Forex ...
124# Bollinger Bands Scalping - Forex Strategies - Forex
4# Bollinger Bands, and CCI - Forex Strategies - Forex Resources
8# Bollinger Bands Multitimframe - Forex Strategies - Forex ...
13# Bollinger Bands Bounce - Forex Strategies - Forex Resources
181# Bollinger Bands Stop - Forex Strategies - Forex Resources
188# Bollinger Bands and Stochastic - Forex Strategies - Forex ...
201# T3 Clean and Bollinger Bands - Forex Strategies - Forex ...
337# Bollinger Bands Stop Forex System - Forex Strategies -
32# Inside Bar with Bollinger Bands - Forex Strategies - Forex ...
