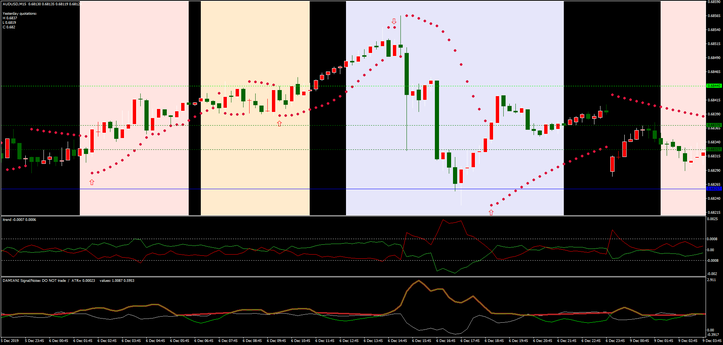
I-trend, with Parabolic Sar filtered by Damini Volameter.
Trend following with Parabolic Sar and I-trend indicators
High Probalility of winning trades
Submit by Dimitri
I-trend, with Parabolic Sar filtered by Damini Volameter is a trend following strategy for day trading. The strategy is very simple to manage.
Currency Pairs: AUD/USD, NZD/USD, AUD/CAD, EUR/USD, USD/CHF AUD/NZD.
Time Frame 15 min (Day Trading).
Metatrader4 indicator setting:
I-Trend (band periods 20, Deviation period 2.0) Power period 13,
Parabolic Sar 0.02- 0.02
Pivot Points Levels Auto
Damiani Volameter default setting.
Trading rules I-trend, with Parabolic Sar filtered by Damini Volameter.
Buy:
1. I-trend green line above red line.
2. Damiani Volameter stopped drawing the red flat line.
3. Parabolic SAR indicator points are below the price
4. The i-ParamonWorkTime indicator draws a rectangle (working hours, optional)
5. The candle broke through the Pivot level from bottom to top(optional)
Sell:
1. I-trend red line above red line.
2. Damiani Volameter stopped drawing the red flat line.
3. Parabolic SAR indicator points are above the price
4. The i-ParamonWorkTime indicator draws a rectangle (working hours, optional)
5. The candle broke through the Pivot level from top to bottom(optional)
Add moving average 21 periods, close to improve filter and decrease false signals. (see examples below in the pictures).
Conditions: Buy 21MA> Candle; Sell 21MA <Candle
Exit Position
1. Parabolic SAR has changed dirextion.
2. Reached the goal to the level of Support / Resistance
3 Initial stop loss on the previous swing high/low.
In the pictures I-trend, with Parabolic Sar filtered by Damini Volameter.


