175# Double Supertrend Strategy — Buy & Sell Signal System -TradingView
Janus Trader 2026
Double Supertrend strategy captures directional moves in trending markets by combining two Supertrend indicators operating at different speeds. No external filters
are needed — the filtering logic is built directly into the signal conditions through the relationship between the minor and major Supertrend. ATR-based dynamic levels handle risk management
automatically, adapting to current market volatility.
Setup
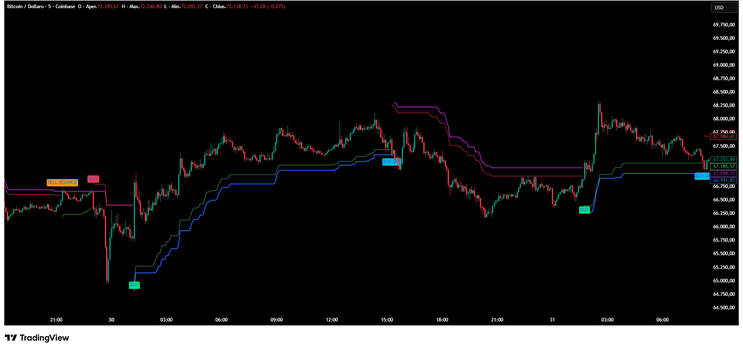
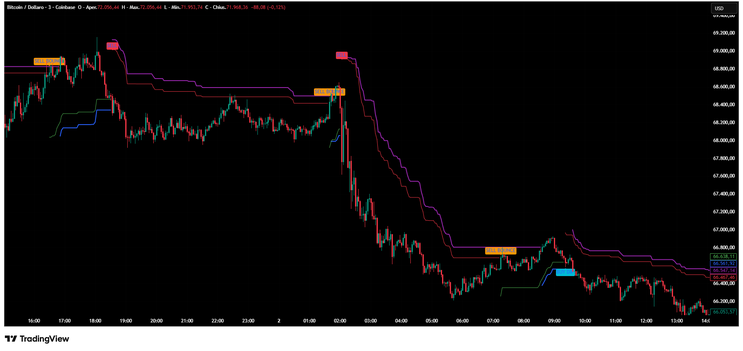
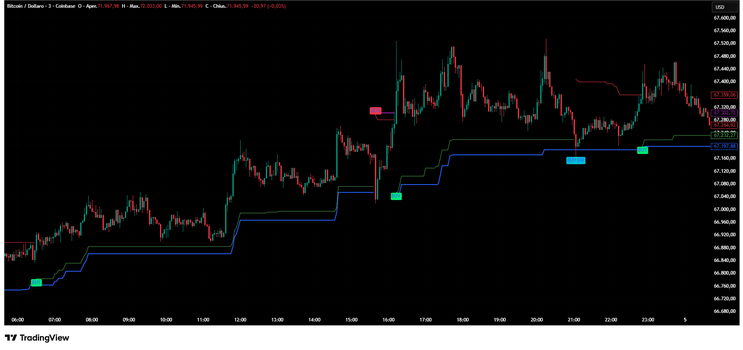
Apply the indicator to any chart. It plots two Supertrend lines simultaneously: a major Supertrend (ATR 14, multiplier 6.0) shown as a thick blue line in uptrends and purple in downtrends, which defines the dominant trend direction; and a minor Supertrend (ATR 10, multiplier 3.0) shown as a thin green line in uptrends and red in downtrends, which reacts faster to price changes and generates the trading signals. All signals are confirmed on bar close only, avoiding premature entries.

Buy
Long Entries Two distinct long signals are generated. The BUY signal (green label) fires when the minor Supertrend flips from bearish to bullish while the major Supertrend is already in uptrend — both aligned to the upside, this is the primary trend-following entry. The BUY DIP signal (aqua label) fires when the major trend remains bullish but the minor Supertrend temporarily breaks lower, signaling a pullback within the dominant uptrend — an entry opportunity for traders who prefer to buy into weakness. Place the stop loss below the minor Supertrend at entry. Set take profit with a fixed risk-to-reward ratio or trail with the major Supertrend.

Sell
Short Entries Two mirrored short signals are generated. The SELL signal (red label) fires when the minor Supertrend flips from bullish to bearish while the major Supertrend is already in downtrend — both aligned to the downside, this is the primary trend-following short entry. The SELL BOUNCE signal (orange label) fires when the major trend remains bearish but the minor Supertrend temporarily bounces higher, signaling a retracement within the dominant downtrend — an entry opportunity for traders who prefer to sell into strength. Place the stop loss above the minor Supertrend at entry. Set take profit with a fixed ratio or trail with the major Supertrend.
Conclusion
The Double Supertrend strategy requires no additional indicators. The major Supertrend acts as the context filter — primary signals fire only when both Supertrends agree, while dip and bounce signals allow entries during pullbacks within the dominant trend. Consistency depends on strict execution and risk management aligned with the dynamic Supertrend levels, not on trading frequency.
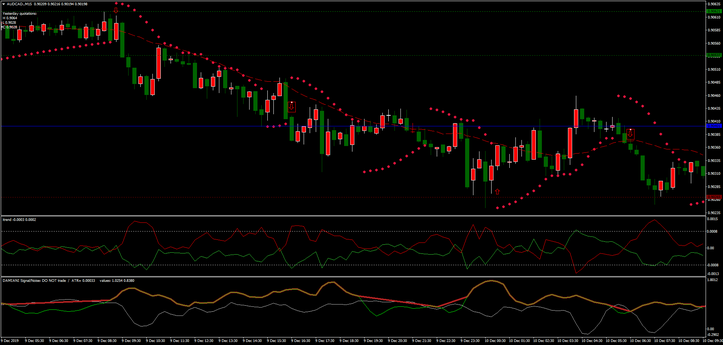
I-trend, with Parabolic Sar filtered by Damini Volameter.
Trend following with Parabolic Sar and I-trend indicators
High Probalility of winning trades
Submit by Dimitri
I-trend, with Parabolic Sar filtered by Damini Volameter is a trend following strategy for day trading. The strategy is very simple to manage.
Currency Pairs: AUD/USD, NZD/USD, AUD/CAD, EUR/USD, USD/CHF AUD/NZD.
Time Frame 15 min (Day Trading).
Metatrader4 indicator setting:
I-Trend (band periods 20, Deviation period 2.0) Power period 13,
Parabolic Sar 0.02- 0.02
Pivot Points Levels Auto
Damiani Volameter default setting.
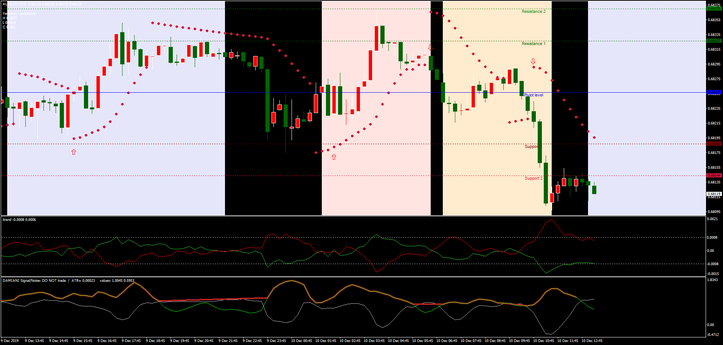
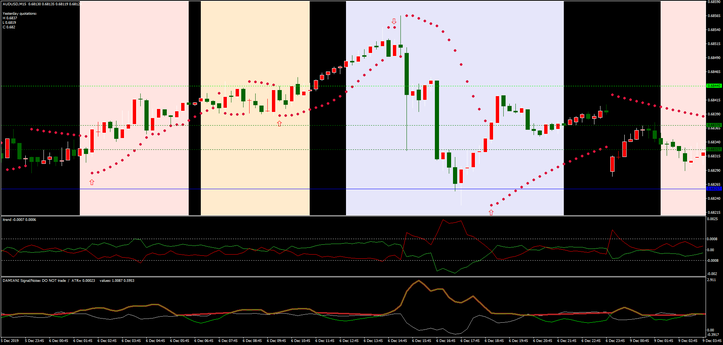
Trading rules I-trend, with Parabolic Sar filtered by Damini Volameter.
Buy:
1. I-trend green line above red line.
2. Damiani Volameter stopped drawing the red flat line.
3. Parabolic SAR indicator points are below the price
4. The i-ParamonWorkTime indicator draws a rectangle (working hours, optional)
5. The candle broke through the Pivot level from bottom to top(optional)
Sell:
1. I-trend red line above red line.
2. Damiani Volameter stopped drawing the red flat line.
3. Parabolic SAR indicator points are above the price
4. The i-ParamonWorkTime indicator draws a rectangle (working hours, optional)
5. The candle broke through the Pivot level from top to bottom(optional)
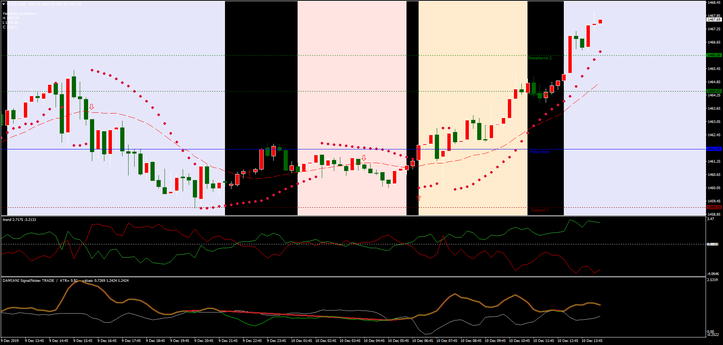
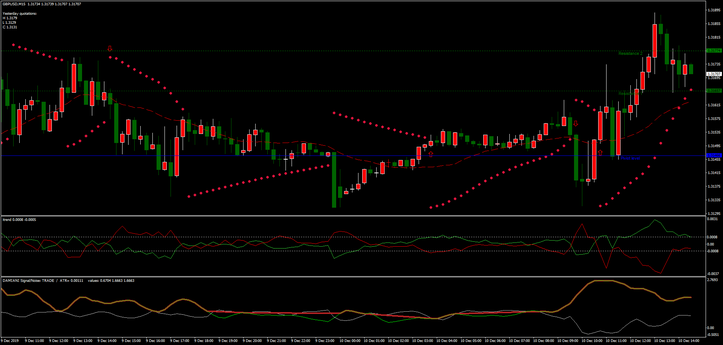
Add moving average 21 periods, close to improve filter and decrease false signals. (see examples below in the pictures).
Conditions: Buy 21MA> Candle; Sell 21MA <Candle
Exit Position
1. Parabolic SAR has changed dirextion.
2. Reached the goal to the level of Support / Resistance
3 Initial stop loss on the previous swing high/low.
In the pictures I-trend, with Parabolic Sar filtered by Damini Volameter.