


168# Binary Monster
Dimitri 2025
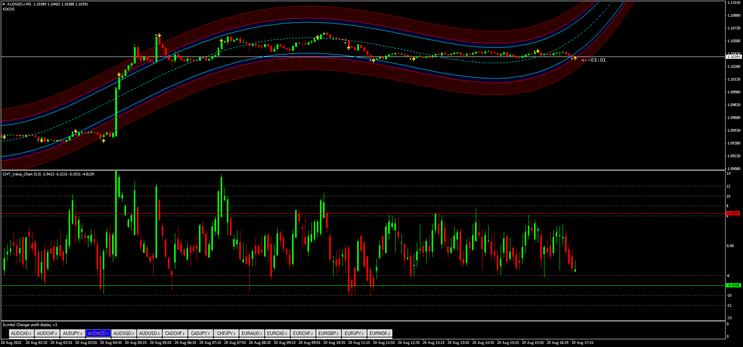
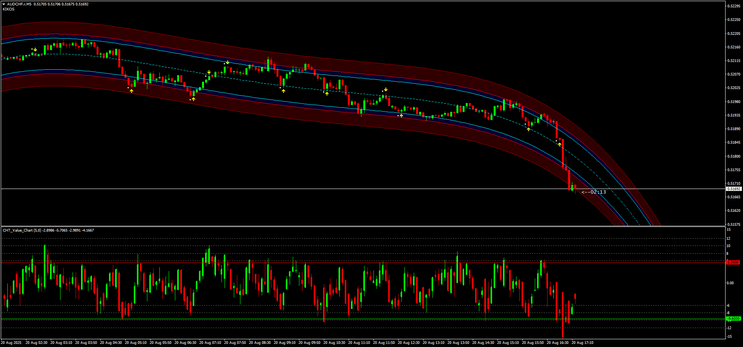
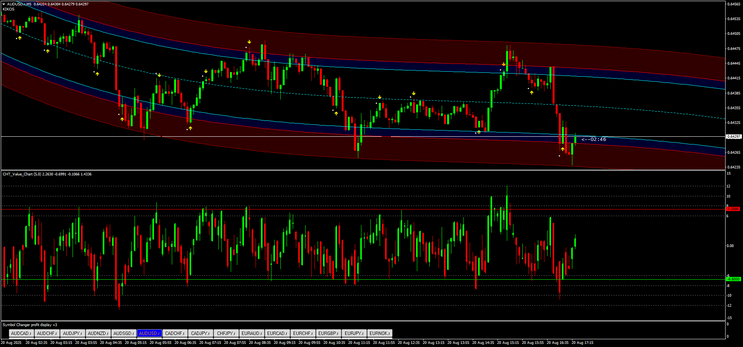
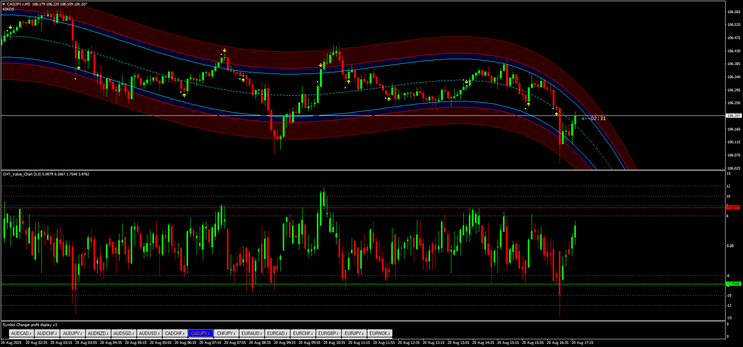
Binary Monster strategy is designed for short‑term trades (expiry 5 candles) on any liquid currency pair. It combines a price‑action channel (the BinaryKikos band from the Monster X V2 Trend indicator) with two momentum oscillators (Monster X V2 Overbought/Oversold and CHT Value Chart). The idea is to buy (call) when price hits the lower band and the oscillators indicate oversold, and sell (put) when price hits the upper band and the oscillators indicate overbought. Because trades expire after 5 candles, the strategy works best on M1–M5 charts, offering a balance between noise and reaction speed.
Setup
|
Element |
Details |
|---|---|
|
Markets |
Any major currency pair with tight spreads (e.g., EUR/USD, GBP/USD, AUD/USD). Avoid exotic or low‑liquidity pairs. |
|
Time‑frame (TF) |
1‑minute to 5‑minute charts. The lower the timeframe, the more signals you will see. |
|
Expiration |
5 candles. For example, on M5 charts the option expiry is 25 minutes; on M1 charts the expiry is 5 minutes. |
|
Indicators |
• Monster X V2 Trend / BinaryKikos (main chart): plots a dynamic channel consisting of dark‑red outer bands and blue mid‑bands. Yellow arrows appear when price touches an extreme. • Monster X V2 CandleTime: optional timer shows how much time is left in the current candle; this helps enter at the open of the next candle. . • CHT Value Chart (5.0) (second sub‑window): a histogram showing relative value; bars above +6 are considered overbought (red zone) and bars below –6 are oversold (green zone). |
Entry rules
General guidelines
-
Avoid trading immediately before or during major economic news releases. Strong news can invalidate band signals.
Trade only when the BinaryKikos bands are sloping slightly upward or downward. If the bands are flat and narrow (choppy market) the probability of reversal decreases.
Wait for a clear confluence: price touches the outer Kikos band, the overbought/oversold oscillator agrees, and the value chart confirms.
Call (Buy) option
-
Price condition (BinaryKikos)
-
On the main chart, wait for a candle to touch or close at the lower dark‑red area of the Kikos band. A yellow up‑arrow often appears at these points.
-
-
Value confirmation (CHT Value Chart)
-
In the second sub‑window, the histogram should be at or below the green oversold band (–6) or just crossing upward out of it. Bars should transition from red/neutral to green.
-
-
Timing
-
Enter a call option on the open of the next candle after all above conditions are met. The expiry is 5 candles (e.g., 5 minutes on a 1‑minute chart or 25 minutes on a 5‑minute chart).
-
Rationale: when price hits the lower band, it often signals exhaustion within an upward sloping channel. Oversold readings in the oscillator and value chart suggest sellers are losing momentum and a bounce is likely. Entering at the next candle reduces slippage and gives the trade room to breathe.
Put (Sell) option
-
Price condition (BinaryKikos)
-
Wait for a candle to touch or close at the upper dark‑red area of the Kikos band. A yellow down‑arrow often marks these peaks.
-
-
-
Value confirmation (CHT Value Chart)
-
The histogram should be at or above the red overbought band (+6) or just crossing downward out of it. Bars should transition from green/neutral to red.
-
-
Timing
-
Enter a put option on the open of the next candle after conditions line up. Use the same 5‑candle expiry.
-
Rationale: price reaching the upper band suggests a potential reversal in a downward‑sloping or sideways channel. Overbought readings on the oscillator and value chart confirm that buyers may be exhausted and a pullback is probable.
Trade management and risk
-
Do not over‑trade. Expect only a few high‑quality signals per session.
-
Risk only a small percentage of account balance per trade (e.g., 1–2 %). Binary options can be all‑or‑nothing; proper risk control is essential.
-
If price closes outside the Kikos band (break‑out), skip the trade—break‑outs often lead to trend continuation and will not reverse within 5 candles.
-
Test the strategy on a demo account to gain confidence before committing real money.
This approach uses a combination of price location (Kikos bands) and momentum (Monster X oscillator and CHT Value Chart) to find short‑term reversal points. By waiting for multiple confirmations and using a consistent expiry period, traders can improve their odds in fast‑moving binary option markets.
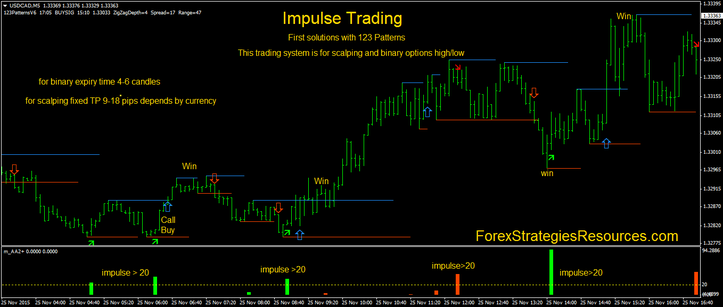
168# Impulse Trading
Dimensional trading
Submit By Dud 25/11/2015
Impulse trading is a technique based on an indicator of pulses for the trade.
Impulse indicator can be interpreted in multiple ways.
I will post more ways of using impulse indicator. The first way that I propose to use in trading is with 123 patterns indicator.
This technique is suitable to the scalping that for trading binary options high / low.
Expiry time 4-6 candles.
Time Frame 5 min or higher
Currency pairs:any.
Metatrader Indicators:
Impulse Indicator (level 20).
123 patterns
Trading rules Impulse Trading
For a conservative trading they take into consideration the signals that come from higher impulses to 20 level.
Impulse with green bar is for buy.
Impulse with red bar is for sell.
Buy
when a green arrow appears to wait for a buy signal pattern 123.
Sell
when a green arrow appears to wait for a buy signal pattern 123.
Exit position with predetermined profit target.

Update with Cycle bar indicator, this indicator is more stable and do not repaint.
This indicator is translate from Easy language (Tradestation) at the Mql4.

