


203# MA Channel Close AD
Ma Channel Modified
Submit by Lorenz 05/2017
Ma channel close AD, the main property of any MA - to indicate the direction of the trend - during periods of apparent lack of such (that is - flat) is significantly weakened. Usually such a problem is solved by constructing several averages, and this technique proposes to form a price channel according to the history between the points of intersection of moving averages, more precisely, two consecutive (neighboring) ones.
We get the so-called "trend channel medium". Structure of MA Channel close: if the first intersection of fast MA slow up (with bottom movement) and the subsequent one from top to bottom occurs at a certain price interval, then such a section is implied as part of the bullish trend. The maximum price on this interval determines the upper limit of our channel. Similarly, if the first intersection occurs first (when moving from above), and then - from the bottom up, then the site works as a descending one. The price minimum on this interval defines the lower limit.
MA channel consit consist of channel boundaries, that is, 2 lines, which, depending on the interpretation of signals, are represented either as a solid line or dotted lines. Indicator parameters are given with a detailed description, the settings can be changed:So, what do the lines mean:
• Continuous - signals that a new (unbroken) support / resistance level has been formed.
• Dashed line - the key level is broken, that is, the corresponding trend develops.
If the channel boundary is broken:
• lower - the trend is bearish (falling);
• upper - bullish (growing).
dentification of the actual trend occurs by changing the display style of the boundary lines, respectively:
• when the trend is active, the lower boundary is drawn by a dotted line (red), whereas the upper boundary is displayed as an unbreakable level (solid blue);
• when the current trend changes to the ascending one, the dotted line of the blue color forms a boundary from above, and the unbroken lower level is displayed solid (red).
The goal of building horizontal channels is usually to search for points to open deals on the breakdown of the border or rollback in the direction of the opposite border.
How to use MA Channel for trading with Binary options high/low?
I propose one way as example.
First
MA channel close AD with EMA 100
Time Frame 5 min or higher.
Session London and New Yor for 5 min time frame.
Currency pairs: any.
Expiry time 2 candles or 2-3 min (applied at the 5 min chart).
Metatrader Indicators:
Ma channel close AD (1, 18)
MACD 2 line ( 12, 16, 9)
FTP EMA 100
Trading Rules
Buy or Call
Price above red line of the MA Channel.
Buy dot arrow of the 100 EMA
MACD crosses upward or MACD histogram above zero line.
Sell or Put
Price below blue line of the MA Channel.
Sell dot arrow of the 100 EMA
MACD crosses downward or MACD histogram below zero line.
The filter of 100 EMA in this case is not considered.
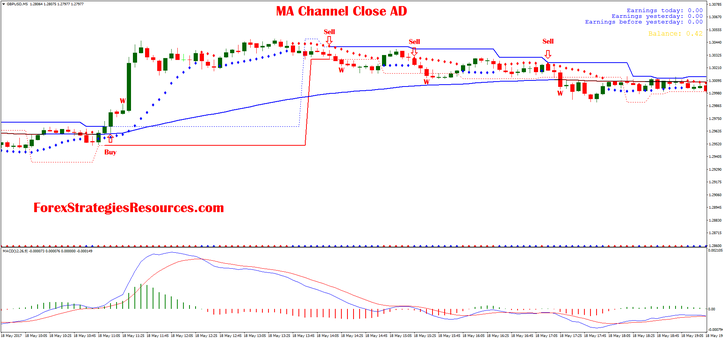
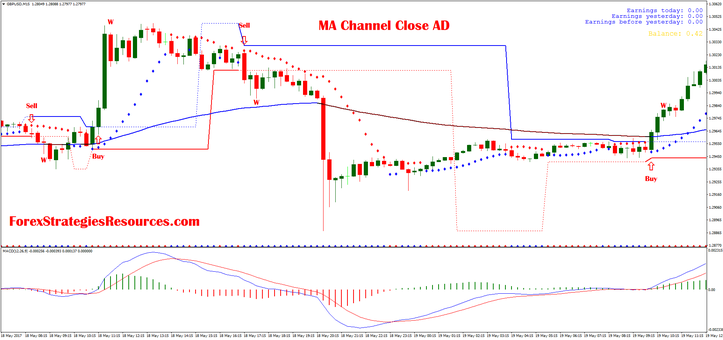
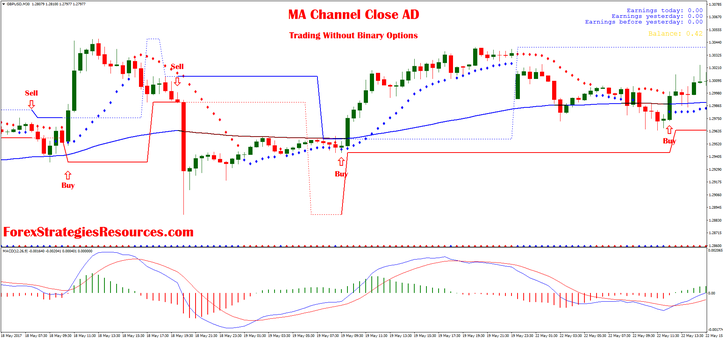
In the pictures MA channel close AD in action.

Mauro (Friday, 13 July 2018 10:58)
Which Forex pair and time frame is best to trade" is the frequently asked question and I want do give you the DEFINITE ANSWER.
Are you expecting that I am going to say something like EUR/USD on 5-minute time frame or GBP/USD on daily...? No, it is not so simple, but SIMPLE ENOUGH we can figure it out!
The "PROBLEM" is that markets change over time. If GBP/USD was a well trending currency pair a few years ago, today it is another one.
I actually want to let you know about a SPECIAL TOOL that I use to find the BEST TRENDING PAIRS among all the Forex pairs