


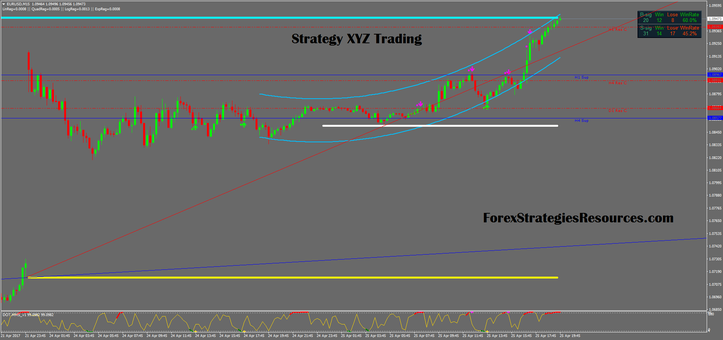
199# Strategy XYZ trading
Support and resistance with RSI dot MMS
Strategy XYZ: TBL indicator, RSI dot MMS, Regression
Submit by Leopard 04/2017
Strategy XYZ trading is based on support and resistance with RSI. This trading system is for binary options, options and good also for trading without Options. Great Trading!!!
The "indicators and template are in the" folder, We use terminal MT4.
I Have already an updated version of the strategy with increased profitability.
Open in Terminal graphs of 6 currency pairs: EUR / USD, GBP / USD, AUD / USD, USD / CHF, EUR / JPY and USD / JPY.
Binary Options Expiry time 1 or 2 candles.
Target Profit 8-15 pips depends by currency pairs.
Tf m15. The pattern looks like this:
The strategy uses 2 level indicators, one channel and two switchesmen.
I set default levels to show levels from only H1 and more, for
Reliability, so that work is carried out with stronger levels.
Avoid the news 15 minutes before and after one and two heads, if the news is stronger, then do not trade half an hour before and after. We trade only in the European and American sessions.
We avoid the beginning of America 15 minutes before and after.
2. Trading Rules
The rules for buying an option to decrease:
1. There is a purple dot.
2. The price is at the top level (hour, four hour) or broke it.
3. The price is at the top edge of the channel or has left for it.
4. Prepare a deal, if a candle appears purple and orange hands, then
Enter the auction.
Rules for buying an option to raise:
1. A green dot has appeared.
2. The price is at the lower level (hour, four hour) or broke it.
3. The price is at the bottom edge of the channel or went for it.
4. Prepare a deal if the green and orange arrows appear when the candle is opened, then
Enter the auction.
It should be noted that the main condition is the level and appearance of a circle on the signal and two shooter on a new candle. There is an additional - on the chart are automatically plotted trend Line, if the price has reached it, then you can also take it.
Examples:
As you can see, a circle appeared, and on the new candle both the green and orange arrows. They appear right at the opening of the candle, as soon as it opened and the arrows appeared, we boldly enter the 15 minutes. The figure shows that the price went to the level and rolled it away with a new candle.
Another example, if there was a level, you could enter:

Another example, if there was a level, you could enter:
Sometimes it happens that there is a circle and only one arrow appeared, the deal went into negative, and on
The next candle appeared orange arrow. And all this happens near the level. In such
You can also enter the transaction. However, this is considered an additional rule.
As we can see, the deal went into negative, there was another bearish candle and at the opening of the next candles appeared arrow, in which case you can enter.
Use martingale can be as the next candle, and the signal. However, I advise
trade without martingale, but an increased lot - 5% of the depot. The bar should be set at 10-15% to deposit for the day. True, signals with the exact coincidence of all the rules for the day is not so much – 5-6, but they are worth it. Practice on the demo, and then go on to the real. Remember: point + two
Arrows when you open a candle + level = happiness.

Write a comment
luis ronald huaygua cori (Monday, 22 April 2024 03:47)
obrigado