


12# Balance Breakout Strategy -TradingView-
Dimitri 2025
The Balance (IB) represents the first trading range of a session — usually the price action that occurs within the first hour after the market opens (for example, 08:30–09:30).
This period often sets the tone for the day, establishing the key high and low boundaries that define potential breakout levels.
The Balance Breakout Strategy identifies these ranges automatically and plots visual markers for:
-
The IB High and Low,
Fibonacci retracement levels inside the range,
Extension zones above and below the range,
Forecasted breakout targets, calculated statistically from historical data.
How It Works
-
Identify the Initial Balance (IB)
-
The indicator automatically detects the session’s first-hour range.
The top line marks the highest price of the IB.
The bottom line marks the lowest price of the IB.
A shaded box highlights this zone on the chart.
-
-
Forecast and Extensions
-
Once the IB is complete, the script plots forecast levels above and below the range, using past IB movements.
Optional extensions (50% or custom values) project potential continuation zones beyond the IB.
Fibonacci levels (23.6%, 38.2%, 50%, 61.8%, 78.6%) are also drawn to show retracement or breakout thresholds.
-
-
Breakout Detection
-
When price closes above the IB high, a bullish breakout signal (triangle up) appears.
When price closes below the IB low, a bearish breakout signal (triangle down) appears.
These signals are displayed only after the Initial Balance period ends.
-
-
Forecasting Logic
-
The indicator can project the next IB range using two modes:
-
IB Against Previous Open: Calculates the average distance between previous IB highs/lows and the previous day’s IB open.
Filter by Current Day of Week: Uses data from the same weekday to forecast typical IB range movement.
The Forecast Multiplier lets traders expand or tighten this projection.
-
-
Trading Rules
|
Condition |
Signal |
Action |
|---|---|---|
|
Price closes above IB High |
🔼 Bullish Breakout |
Consider long positions |
|
Price closes below IB Low |
🔽 Bearish Breakout |
Consider short positions |
|
Candle remains inside IB range |
⚪ Neutral |
Wait for breakout confirmation |
|
Forecast zone reached |
🎯 Target |
Partial or full take profit |
Stop-Loss:
-
For long trades → below IB Low
For short trades → above IB High
Take-Profit:
-
Based on the projected forecast level or extension percentage
A common ratio is 1:2 or 1:3 risk-reward
Strategy Insights
-
Morning range matters: The first 60 minutes often define institutional positioning.
Breakouts with volume or strong momentum are more reliable.
False breakouts often occur near Fibonacci retracement levels — use them as warning zones.
Combine with a higher-timeframe trend filter (e.g., 50 EMA) to trade in the direction of the broader move.
Customization Options
-
Auto Session Detection: Adjusts automatically based on market hours.
Display Modes: Toggle between showing only the last IB or all historical ones.
Fibonacci & Extensions: Turn on/off or customize each level.
Forecast Settings: Choose memory length, multiplier, and day-based filters.
Example Application
-
Wait for the IB period to complete (e.g., 09:30).
-
Observe the IB range and any forecasted extensions.
-
Enter when price breaks and closes beyond the IB boundaries.
-
Use forecast levels as take-profit targets, managing risk below/above the IB.
This approach captures post-open volatility, when institutional activity defines daily direction.
Conclusion
The Initial Balance Breakout Strategy by LuxAlgo offers a structured,
data-driven approach to breakout trading.
It combines market session logic, Fibonacci
precision, and historical forecasting to help traders
identify high-probability continuation moves after the morning range.
Whether you trade futures, forex, or crypto, this indicator provides a clear visual roadmap for session-based breakout opportunities.
Hans Breakout Trading System
Submit by joy22
Time Frame: 15, 30, 60 min
Pairs:Eur/USD, GBP/USD
Long Entry
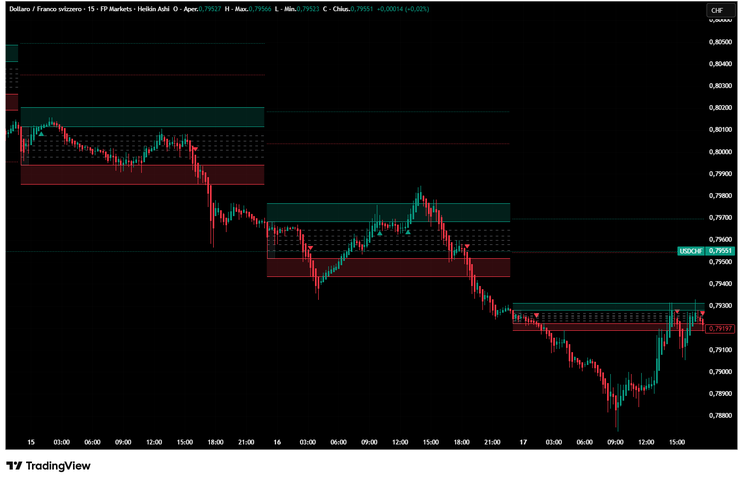
Buy when price crosses up red dot (resistance). There can be two trades in a single day, because there're two string of red dots.
Short Entry
Sell when price crosses down blue dot (support).
Set stop loss 50 pips away (EURUSD) or 70 pips (GBPUSD). If the other end ofbreakout is closer, then set SL to the breakout.
Close all orders and trades when the dots end.
Profit Target: 65 pips EUR/USD, 80pips GBP/USD
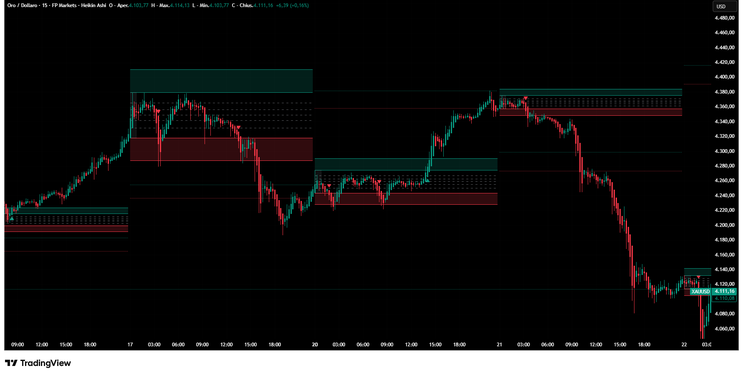
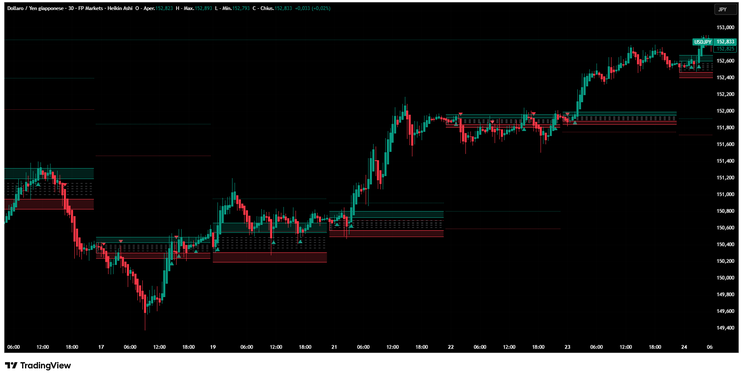
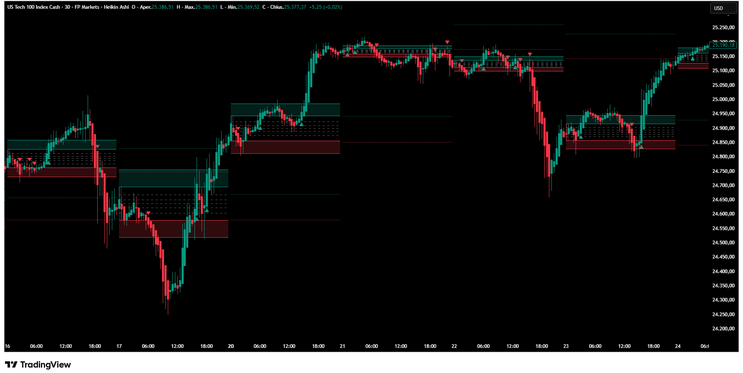
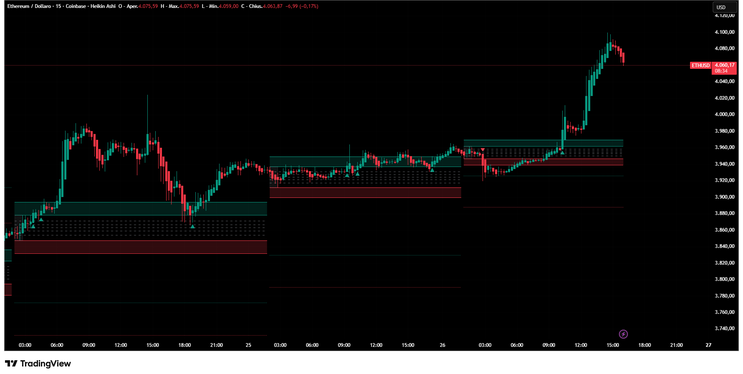
In the picture below Hans Breakout Trading System in action.
40# Hans123 Breakout - Forex Strategies - Forex Resources - Forex ...
19# Magic Breakout - Forex Strategies - Forex Resources - Forex.
25# 2 Days Breakout - Forex Strategies - Forex Resources - Forex
8# Breakouts System - Forex Strategies - Forex Resources - Forex
15 Box Breakout System 2 - Forex Strategies - Forex Resources ...
36# Early Bird - Forex Strategies - Forex Resources - Forex Trading
22# Asian Breakout II - Forex Strategies - Forex Resources - Forex
17# Range Breakout - Forex Strategies - Forex Resources - Forex
