


48# Neptune 3, 1min Scalping Trading System
Neptune Scalping
Neptune 3 Update 02/2024
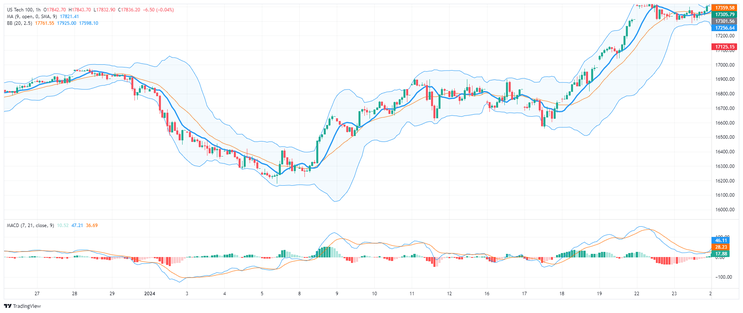
Bollinger Bands and MACD reversal is a classic but very effective basic strategy.
The logic is very simple: you have to wait until the price touches or exits the Bollinger bands and wait until the price is first lower or higher than the controlling moving average and then the MACD crosses in the opposite direction.
Setup Strategy
5 minutes or more
Currency pairs: any. Best EURGBP, AUDNZD, AUDCHF
Strategy suitable for day trading and swing trading.
Indicators
Bollinger Bands periods 25 deviation 2.5
Simple Moving Average 9 periods close,
MACD (7,21,9).
Trading Rules
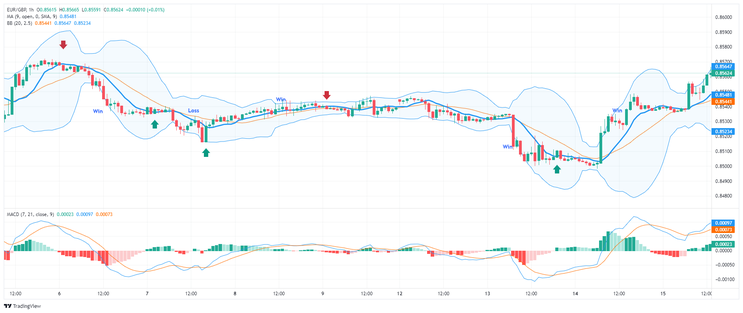
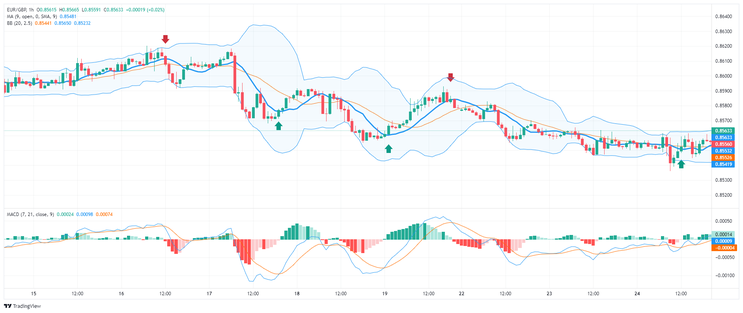
Buy
When the price touches or exceeds the lower band, first wait for the price to be greater than the 9-period moving average, then for the MACD to cross upwards.
Sell
When the price touches or exceeds the lower band, first wait for the price to be greater than the 9-period moving average, then for the MACD to cross upwards.
Stop loss on the previous high/low swing.
Take profit middle line or stop loss ratio 1:1.15.

Submit by Forexstrategiesresources
Time Frame 1min.
Pairs: Eur/USD, GBP/USD.
Bands: set at (20, 3), Exponential.
Moving Average 3 Exponential,
MACD Histogram Study (6,17,8)
Relative Strength Index Study set at 14.
Long entry:
Wait for the 3 EMA to cross up through from the 18 Bollinger Bands Middle line.
· Wait for the Relative Strength Index and MACD Histogram to line up: Above 0 (MACD) and above 50 (RSI) for
signal. Below 0 (MACD) and below 50 (RSI) for SELL signal.
Short Entry:
Wait for the 3 EMA to cross down through the 18 Bollinger Bands Middle line.
· Wait for the Relative Strength Index and MACD Histogram to line up: Above 0 (MACD) and above 50 (RSI) for
signal. Below 0 (MACD) and below 50 (RSI) for SELL signal.
Exit Position
Place stop loss for buy on Lower Band.
Place Stop Loss for sell on upper band.
Profit Target
Place profit target on opposite band.
Profit target EUR/USD5-7 pips, GBP/USD7-9 pips

Share your opinion, can help everyone to understand the forex strategy.
3# Neptune System - Forex Strategies - Forex Resources - Forex
4# Neptune Advanced - Forex Strategies - Forex Resources -
20#Psych Level Scalping System
68# MTF Gann Activator and Neuro Strength - Forex Strategies ...
81# BBox Advanced Scalping System
119# Sonic R System - Forex Strategies - Forex Resources - Forex
17# SD System - Forex Strategies - Forex Resources - Forex ...
8# The 5 minute standard deviation scalp - Forex Strategies - Forex

Write a comment
Sat150 (Wednesday, 13 June 2018 05:05)
The settings for BB is it 20 or 18?. And how to set it to exponential
ferdyfinance (Monday, 18 June 2018 01:33)
THE PIC IS 1H CHART ?