


62# Ema's crossover filtered by RSI with flat zone - TradingView Strategy -
Classic Trend Momentum Strategy
RSI as filter
Submit by Dimitri
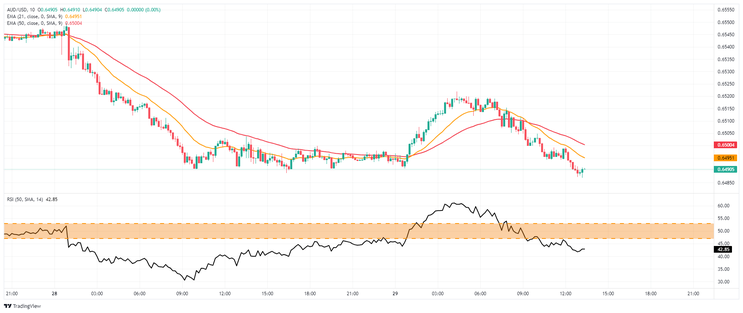
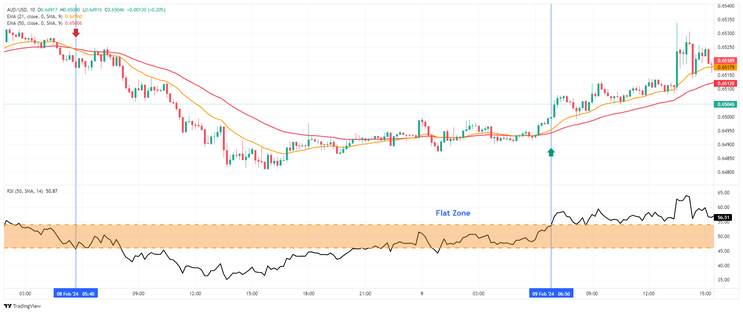
Ema's crossover filtered by RSI with flat zone is a classic strategy to which I made a double modification to adapt it to the 10 and 15 minute time frame. The strategy is trend momentum based on the crossing of two exponential moving averages of 21 and 50 periods filtered by the RSI with period 50 and levels 53-47 to filter buy and sell signals.
Setup Strategy
Time Frame 10 min or 15 min.
Currency pairs: Majors, Minors and indices.
Indicators TradingView
Exponential Moving Average 21 periods, close.
Exponential Moving Average 50 periods, close.
RSI 50 periods, close, level buy 54 – level sell 46. The area between levels 46 and 54 constitutes a flat zone.
Trading Rules
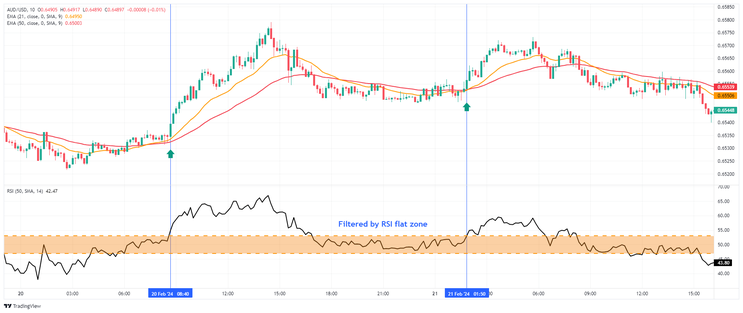
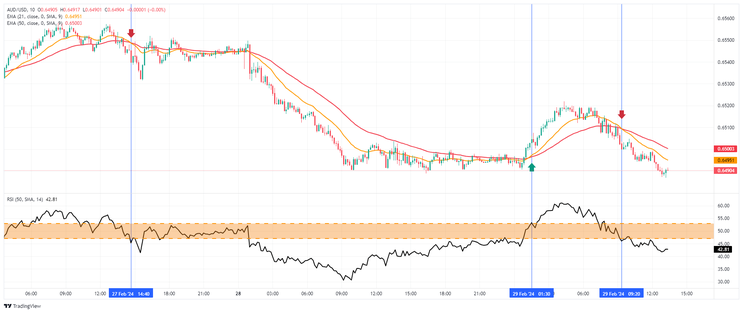
Buy
Ema 21 crosses upward ema 50.
RSI >54
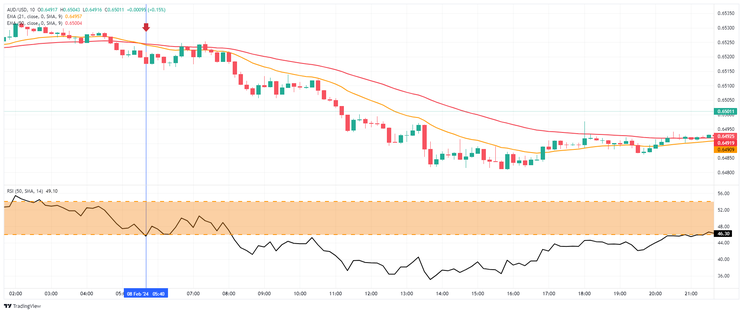
Sell
Ema 21 crosses dowward ema 50.
RSI<46
Exit Position
Profit Target options:
on SR or Pivot levels. 15 30 pips depends on currency pairs, stop loss ratio 1:1.2.
Stop loss on the previous swing high/low.
Kumaresan Trading System
Submit by JanusTrader
Time Frame: 5min
Pairs: AUD/USD, EUR/USD, GBP/USD, GBP/JPY
Focus on Bollinger band
Look for RSI
See the trend strength
Arrow symbol .order of preference are 3, arrow, dot.
How to Trade:
For taking Long position:
Bollinger Band is the first to consider i.e., Look for price oscillations in the band either in the top half or in the bottom half
Kumaresan system using rsi and bb
Bullish signal is seen when the price is in the bottom half of the band on 4hrs, 1 hrs, 30 min, 15 min.
If all are well, then see the free rsi in the next panel, it has to be in the converging mode frombottom and it has crossed in 5 min.
Look for the 3 symbol in the chart.
Enter BUY in the NEXT candle
For taking short position:
Bearish signal is seen when the price is in the top half of the band on 4hrs, 1 hrs, 30 min, 15 min.
If all are well, then see the FREE RSI in the next panel, it has to be in the converging mode from top in 15 min and crossed in 5 min.
Look for the 3 symbol in the chart.
Enter SELL in the NEXT candle.
Share your opinion, can help everyone to understand the forex strategy.
48# Neptune 3, 1min Scalping - Forex Strategies - Forex
118# Trend Hunter Scalping - Forex Strategies - Forex Resources
114# Awesome and Bollinger Bands Scalping - Forex Strategies ...
Hells Angels - Forex Strategies - Forex Resources - Forex ...
69# THV Cobra with TudorGirl's Sinc Spectrum Cycle - Forex ...
25# EMA's Band Scalp - Forex Strategies - Forex Resources -
98# AFX Trader - Forex Strategies - Forex Resources - Forex ...
77# Stochastic, MA, and MACD Scalping
32# The Secret Method - Forex Strategies - Forex Resources -
71# 5m, The Force - Forex Strategies - Forex Resources - Forex ...
104# Vlad System 15 min Day Trading
102# Scalping Trading System " Predator"
16# Mouteki System - Forex Strategies - Forex Resources - Forex ...
138# 5 min Momo Trader - Forex Strategies - Forex Resources ...
8# The 5 minute standard deviation scalp - Forex Strategies - Forex

Write a comment
Max (Friday, 31 May 2013 18:43)
UN sistema simplemente fantastico, apenas estoy viendo la superficie, pero da muy buenas señales, lastima que no exista un manual.