


2#Precision Breakout + RCM Confirmation Strategy for MT5
Joy22 2026
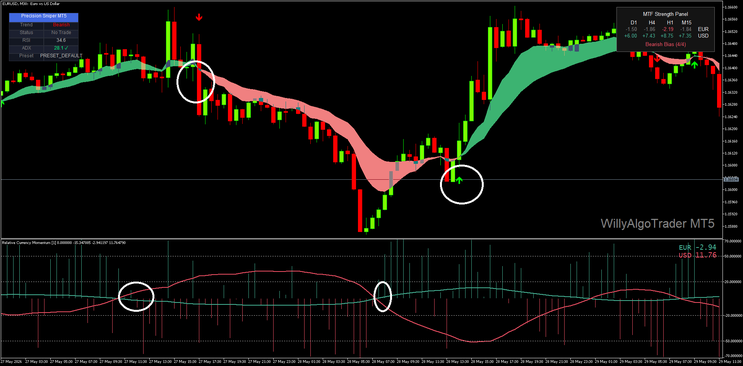
The Precision Breakout + Relative Currency Momentum (RCM) Strategy is a trend-following trading method designed for MetaTrader 5 (MT5). The strategy combines the visual trend identification and entry signals of the Precision Breakout indicator with the currency strength confirmation provided by the Relative Currency Momentum (RCM) indicator.
The objective is to trade only when both indicators align, filtering out low-probability signals and increasing the likelihood of entering strong directional moves.
Setup
Trading Platform
-
MetaTrader 5 (MT5)
Timeframes
-
M15 (15 Minutes) minimum
H1, H4, and Daily charts are also suitable
Currency Pairs
Focus on highly volatile major and cross currency pairs, including:EURUSD, GBPUSD, USDJPY, GBPJPY, EURJPY, AUDUSD, USDCAD, GBPAUD, EURNZD.
Indicators
Main Chart
Precision Breakout
-
Default Settings.
Ribbon Enabled.
Buy/Sell Arrows Enabled.
Subwindow
Relative Currency Momentum (RCM)
-
Default Settings.
Green Line = Base Currency Strength.
Red Line = Quote Currency Strength.
Trading Rules
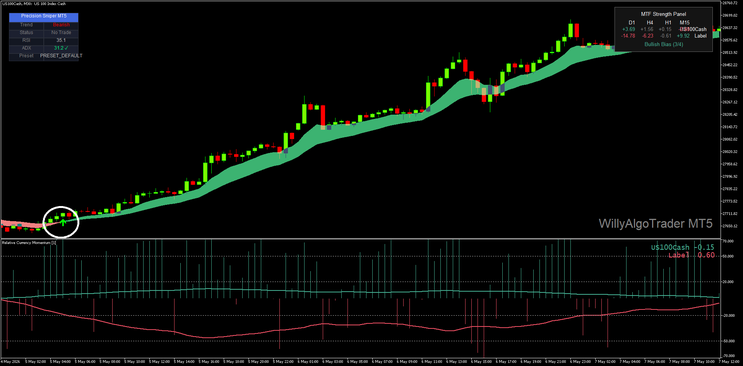
Buy Setup
A BUY trade is valid only when ALL the following conditions are met:
Condition 1 – Precision Breakout Buy Signal
-
A green Buy Arrow appears on the chart.
Condition 2 – Ribbon Confirmation
-
The Precision Breakout Ribbon is green.
Price is trading above or within the bullish ribbon structure.
Condition 3 – RCM Confirmation
-
The green RCM line is above the red RCM line.
Ideally, a recent bullish crossover has occurred, indicating increasing strength of the base currency.
Entry
-
Enter a Buy position at the opening of the next candle after all conditions are confirmed.
Stop Loss
-
Below the most recent swing low.
Alternatively, 1.5 × ATR(14).
Take Profit
-
Risk-to-Reward ratio of at least 1:2.
Or trail the position while the ribbon remains green and RCM stays bullish.
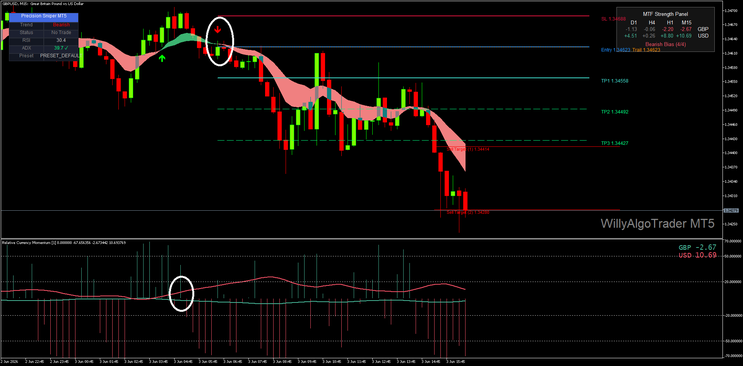
Sell Setup
A SELL trade is valid only when ALL the following conditions are met:
Condition 1 – Precision Breakout Sell Signal
-
A red Sell Arrow appears on the chart.
Condition 2 – Ribbon Confirmation
-
The Precision Breakout Ribbon is red.
Price is trading below or within the bearish ribbon structure.
Condition 3 – RCM Confirmation
-
The red RCM line is above the green RCM line.
Ideally, a recent bearish crossover has occurred, indicating increasing strength of the quote currency.
Entry
-
Enter a Sell position at the opening of the next candle after all conditions are confirmed.
Stop Loss
-
Above the most recent swing high.
Alternatively, 1.5 × ATR(14).
Take Profit
-
Risk-to-Reward ratio of at least 1:2.
Or trail the position while the ribbon remains red and RCM stays bearish.
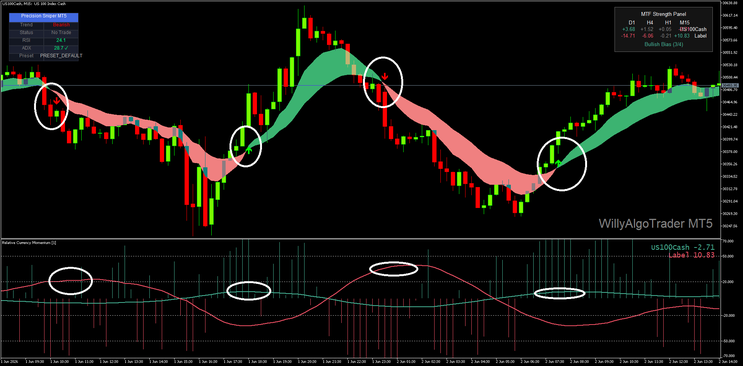
Trade Filters
Avoid taking trades when:
-
The RCM lines are crossing repeatedly without clear separation.
The ribbon is flat and changing color frequently.
Major economic news releases are imminent.
Market volatility is unusually low.
Buy or Sell arrows appear against the RCM direction.
Example
Valid Buy Trade
-
Precision Breakout prints a green Buy Arrow.
-
Ribbon turns green.
-
Green RCM line crosses and remains above the red line.
-
Enter at the next candle open.
Valid Sell Trade
-
Precision Breakout prints a red Sell Arrow.
-
Ribbon turns red.
-
Red RCM line crosses and remains above the green line.
-
Enter at the next candle open.
Conclusion
The Precision Breakout + RCM Strategy combines trend direction, breakout confirmation, and currency strength analysis into a single trading approach. By requiring confirmation from both indicators, traders can avoid many false signals and focus on higher-probability opportunities. The best results are typically achieved on M15, H1, and H4 charts using volatile currency pairs and strict risk management.
2# Open Day Trading System
Intraday Breakout Trading System
Submit by Janustrader 02/04/2011
Setup
1. Open a 1 hour chart at 1:59 EST (GMT-5) and identify the high
and low of the 1:00-2:00 EST bar, see the example below:

The system works on the principle that once a breakout occurs (intraday breakout),
the price is most likely to go strongly in the direction of the
intraday breakout due to the market daily activity after 2:00AM EST.
2) Determine the 1:00-2:00AM EST bar high and low:
High and Low 1:00 AM= 1,4172 high and 1,4157 low
The formula is
1:00-2:00AM bar high/low difference = X
In our case high = 15 pips =X
Long Entry Position for intraday breakout:
Place a BUY STOP order at “1:00-2:00AM EST bar HIGH + X”
level.
In our case the BUY STOP order is 1.4172 + 15 = 1,4187
A stop loss order should be placed at the 1:00-2:00AM EST bar
HIGH. In our case the Stop Loss = 1.4157
Take Profit: (for a buy order)
Option I ( profit 10 pips )
Take profit for a BUY order should be placed at your entry +10
pips. In our case 1,4187 + 10 = 1,4197
Option II ( profit 10 - 100 pips )
(Option II is recommended for traders with trading experience, I
still recommend Option I – 10 pips)
Use a trailing stop = 10-20 pips to maximize your profit. In most
cases you will make 50-100 pips profit in a strong market.
SELL order position for intraday breakout:
Place a SELL STOP order at the “1:00-2:00AM EST bar LOW - X”
level.
In our case the SELL STOP order 1.4157 - 15 = 1,4142
A Stop loss order should be placed at the 1:00-2:00AM EST bar
LOW. In our example the Stop Loss = 1,4172
Take Profit: (for a sell order)
Option I (profit 10 pips)
Take profit for a SELL order should be placed at the entry - 10
pips. In our case 1,4142 - 10 = 1,4132
Option II ( profit 10 - 100 pips )
Use a trailing stop = 10-20 pips to maximize your profit ( as
explained for a buy order ).
Tro 2009 Buy Zone BFD Breakout

Share your opinion, can help everyone to understand the forex strategy.
21# 100 pips daily - Forex Strategies - Forex Resources - Forex ...
32# Counter Strike - Forex Strategies - Forex Resources - Forex ...
20# Two-bar Breakout System - Forex Strategies - Forex Resources
1#Channel Breakout with pullback - Forex Strategies - Forex ...
11# Daily Breakout - Forex Strategies - Forex Resources - Forex ...
