


111# Camarilla Levels Binary System
Tradig Binary Options with Camarilla Levels
Submit by Craig Campbell 30/01/2015
This is where I reveal to you how to make an ALMOST guaranteed return everyday trading binary options.
First of all, we're going to use Camarilla Levels to find our support and resistance points for the entire day.
Camarilla Levels
In 1989, there was a successful UK bond trader by the name of
Nick Stott who was a mathematical trading whiz.
Instead of using judgment and discretion to trade, he eliminated any chance of guesswork by trading scientifically.
And he did so by developing a particular equation that quite simply follows the theory that markets, like most time series, tend to revert to the mean.
In simpler terms, when markets have a very wide spread between the high and low the day before, they tend to reverse and retreat towards the previous day's close.
This in turn makes it easier to accurately predict what today's intraday support and resistance will be.
And this is the equation we use to calculate these support resistance levels:
The CamarillaEquation
Resistance 4-----R4 = (H-L)X1.1/2+C Resistance 3-----R3 = (H-L)X1.1/4+C Resistance 2-----R2 = (H-L)X1.1/6+C Resistance 1-----R1 = (H-L)X1.1/12+C
PIVOT POINT = (H+L+C)/3
Support 1---------S1 = C-(H-L)X1.1/12
Support 2---------S2 = C-(H-L)X1.1/6
Support 3---------S3 = C-(H-L)X1.1/4
Support 4---------S4 = C-(H-L)X1.1/2
I literally used to just plug the numbers into this equation and punch it out on my calculator.
But, you don't have to go that long, laborious route to calculate the levels.
Along with this book, I’ve provided a spreadsheet where you simply plug in the High, Low and Close... and it spits out the levels for you!
The Rule Of Trading
How to trade'UP'
The rule is when a bearish (white) candle hits support and closes on the support, the next candle should be BULLISH (Clear candle), so you trade for the market to go UP immediately after that close of that candle. Be careful to note that...
1) The candle MUST close on the support level OR...
2) It must have touched the support level at sometime and closed as a BEARISH candle
However, if it passes through and closes beyond the support level, it's a NO TRADE.
How to trade 'DOWN'
The rules are exactly opposite for a DOWN trade.
When a BULLISH (white) candle hits resistance and closes on the resistance level, the next candle should be BEARISH (white candle), so you trade for the market to go DOWN immediately after that close of that candle.
1) The candle MUST close on the resistance level OR...
2) It must have touched the resistance level at sometime and closed as a BULLISH candle
However, if it passes through and closes beyond the resistance level, it's a NO TRADE.
Trading Examples The Binary Formula
Now let's look at the profit opportunities.
Remember, the rule is, if a BULLISH candle hits ANY resistance, the candle that follows should be BEARISH only of price CLOSES on or beneath the support line
The same for BEARISH candles: If BEARISH candles hit support, the next candle should be BULLISH if it closes on or above the support line.
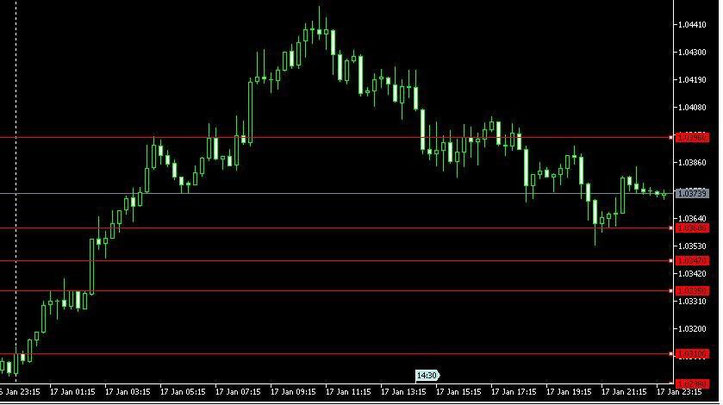
So, in the case of the 17th January 2012, the chart above shows the entire day on a 15-minute time frame.
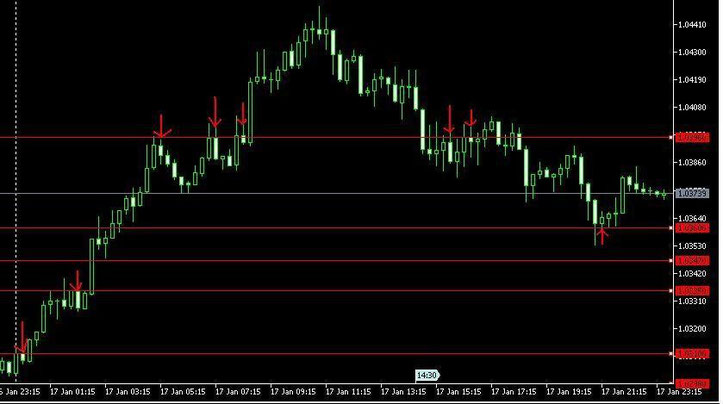
Do you notice that right after taking the data for the previous trading day, you could have profited in 15 minutes after the start of the new day?
The BULLISH candle hit the 1.03100 resistance and the following candle was, of course, bearish.
That's 5 possibilities before midnight!
That's WIN #1.
By about 7.15PM, you could have won again by trading DOWN when the BULLISH candle hit the 1.0335 resistance, with two more opportunities to profit DOWN at the same resistance before heading off to bed!
R4 = 1.5608
R3 = 1.5577
R2 = 1.5577
R1 = 1.5569
S1= 1.5554
S2= 1.5546
S3= 1.5538
S4= 1.5515
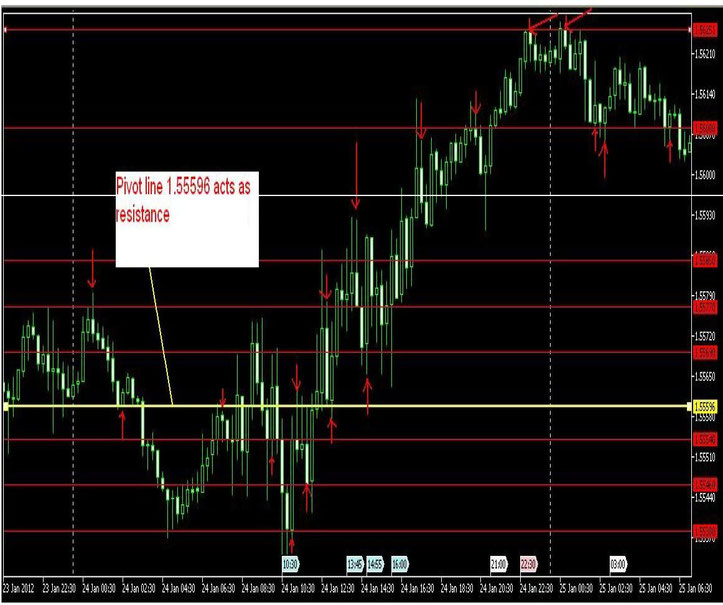
Now, you’ll see that the market opens with the price climbing upward.
So, we're looking for price to hit the first resistance level of 1.5569. It hits it, yes, but price closes ABOVE the 1.5569 so we would disregard that resistance and look for opportunity at the next resistance level which is 1.5577.
So, as you can see, the BULLISH bar hits 1.5577 and closes BELOW
the resistance.
So what do we expect the next bar to be?
A BEARISH WHITE CANDLE.
So, at this point, as soon as the BULLISH bar closes, you place a DOWN trade that must expire in 15 minutes.
Look at that---in just one hour after compiling your data, you could have profited at least 80% and called it a night.
But, in little over another hour, you could have won again! You'll notice that price reversed after hitting 1.5577, broke the 1.5569 support, and sped down towards the PIVOT POINT of 1.55596.
The PIVOT POINT is a support level so you'd look for an opportunity here.
And as you can see, price DOES hit the PIVOT and closes on it with a BEARISH candle.
So what will the next candle be?
A BULLISH candle.
So, as the BEARISH candle closes, you immediately place and UP trade with a 15-minute expiration time.
Another win!
But then price breaks through the PIVOT POINT, reverses and rises to it again. At the third arrow, in this instance it acts as resistance.
So, once the BULLISH candle hits it and closes on it, it's time to strike again!
As per the rules, we expect the next candle to be bearish, so you'd place a DOWN trade immediately as the bullish candle closes and you'd have another winner!
See how simple it is?
Let me point out something similar that happened in a previous example...
If you look at the screenshot, you'll see I drew a horizontal line at 1.56251.
Why did I do this?
Even though it wasn't one of the calculated resistance levels, no doubt price bounced back from there.
This is an emergent strategy.
The market will sometimes reverse at points not calculated.
And you'll just have to use your discretion when this happens especially when price shoots past R4 and S4... as it did in this case with R4 (1.5608)
If you calculated the levels for January 25th, you could have profited from the level from the 24th
Because as the new day started, within 45 minutes you could have won again as price reverted to the high of 1.56251 and turned downwards where you notice the first arrow of January 25.
And there will still 3 more opportunities to profit as price bounced off the old resistance of 1.5608.
Looking back on the 24th January, the chart was riddled with multiple opportunities to for you to profit no matter the time of day.
If you were diligent, you could have made at least 400% on that day alone.

David (Tuesday, 19 September 2017 17:35)
Hi, please how many minutes do you place trades for this strategy
ayo (Tuesday, 03 February 2015 07:52)
can you help with the excell spreadsheet for the calculation.thanks.
Admin (Sunday, 01 February 2015 18:13)
There is no download. It 'a formula to be set with a simple spreadsheet.
Dre (Friday, 30 January 2015 21:04)
Do you have the download link?