


9# Binary options divergence strategy with bollinger bands
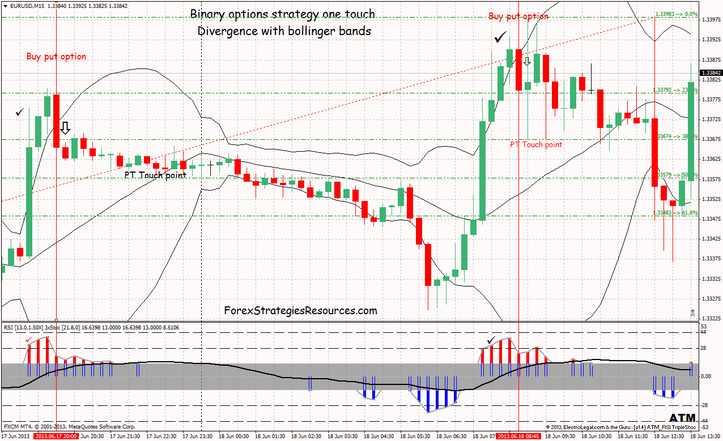
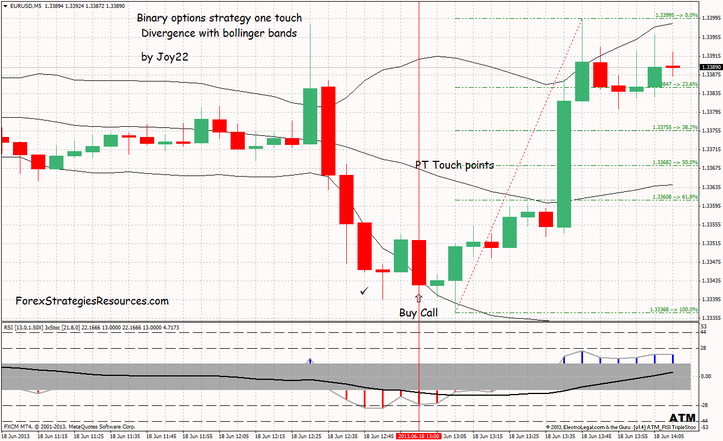
Binary options strategy one touch Divergence with bollinger bands
Submit by Joy 22 18/06/2013
Divergence Method of the trading.
What 's divergence?
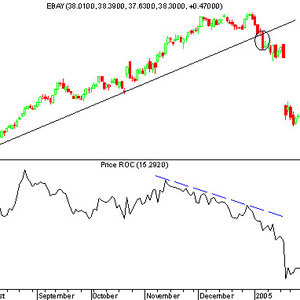
In an up trend that will setup as a bearish trade, you 'll see the price making higher highs but you'll see the indicator making lower high.
In opposite direction?
In an up down taht will setup as a bullish trade, you 'll see the price making lower lows but you'll see the indicator making higher low.
Time Frame 5 min= Time expire 60 min.
Time Frame 15 min= Time expire 180 min.
Metatrader indicators:
ATM RSI Histo Triple Stochastic Divergence indicator;
Fibonacci Retracement: XIT Fib indicator.
The price should be above the upper Bollinger Bands indicator in case of a bearish divergence and in the same manner the price should be below the lower Bollinger Bands indicator in case of a bullish divergence.
When the bullish divergence is spotted (time frame 5 min), it is a signal for buying a 1 hour call option.
Buy When the red bars of the indicator ATM RSI Histo Triple Stochastih Divergence retrace below the dottet black line.
Touch points are the Fibonacci Retracement: XIT Fib indicator.
In the same manner when a bearish divergence is spotted (time frame 5 min), it is a signal for buying a put option.
Sell When the blue bars of the indicator ATM RSI Histo Triple Stochastic Divergence retrace below the dottet black line.
Touch points are the Fibonacci Retracement: XIT Fib indicator.
This method of trading based on divergence can also be applied to Binary otions strategies High /
Low but this method of trading is not for beginners.

schrempfy (Monday, 26 October 2015 15:39)
is there an addon to get an alert, when the retracement is taking place? I cannot look at the chart the whole day... please help/any advice! ? Thanks!
Ismail (Tuesday, 22 September 2015 21:18)
Hello joy22,
How are you doing?
It is very difficult for me to understand to identify the divergence, specifically the sentence "retrace below the dotted black line" can you please help me understand better, awaiting for your reply,
My email: ismailgdte@gmail
alexit69 (Thursday, 14 May 2015 18:14)
Yes , Ken , you are missing something : this is not an expert advisor for forex but a a strategy for binary option with a template (tpl) .
Ken (Sunday, 29 September 2013 18:10)
I would like to test this ea, but when I download and unzip, i'm only getting a .tpl file, i'm i missing something?