


32# Weis Wave Binary Options Strategy (M5)
Janus Trader 2026
Weis Wave Binary Options Strategy combines market structure, short–term trend direction and volume pressure to create higher-probability entries for binary options.
The strategy uses three elements:
-
a 13-period Simple Moving Average to define directional bias
-
fractals (yellow square and gray X) to identify reaction points
-
the Weis Wave Volume to evaluate whether the latest push is gaining or losing strength
The goal is not to predict every move, but to avoid entering when the market is still full of momentum against us.
Setup
Platform: MetaTrader 4
Time Frame:
5 minutes
Expiration Time: 15 minutes (3 candles)
Indicators
-
SMA 13 applied to close
-
Fractals
-
yellow square = swing high/low
-
gray X = minor exhaustion
-
-
Weis Wave Volume
Weis Wave – Difference parameter
The value must match the volatility of the currency pair.
Examples of starting points:
-
normal volatility pairs → 40–50
-
fast pairs → 50–70
-
example: GBP/USD ≈ 60
If you see too many waves → increase.
If waves are too rare → decrease.

Market Logic Behind the Strategy
We want three pieces of information:
-
Where is price positioned relative to the trend? → SMA
-
Has the market produced a reaction or local extreme? → fractal
-
Is the previous movement running out of fuel? → Weis Wave
When those align, probability improves.
CALL Rules
Open a CALL when all conditions are met:
-
Price is above the SMA 13.
-
A fractal appears (yellow or gray) showing a pullback or exhaustion.
-
The last bearish wave shows less volume than the previous bearish pressure, or selling is clearly slowing.
Entry is taken at the opening of the next candle.
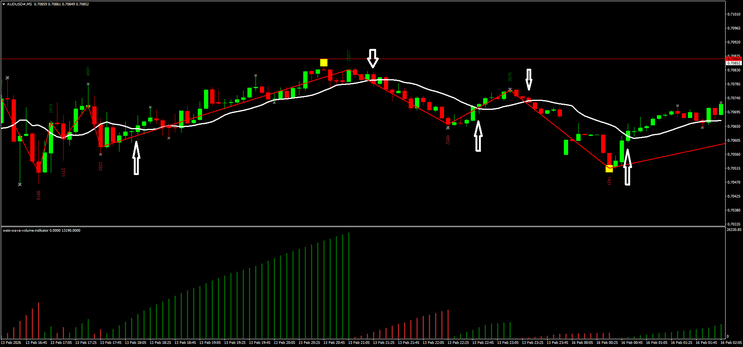
PUT Rules
Open a PUT when:
-
Price is below the SMA 13.
-
A fractal forms, signaling a temporary top or reaction.
-
The latest bullish wave is weaker than the previous one, or buying pressure is fading.
Enter at the next candle.
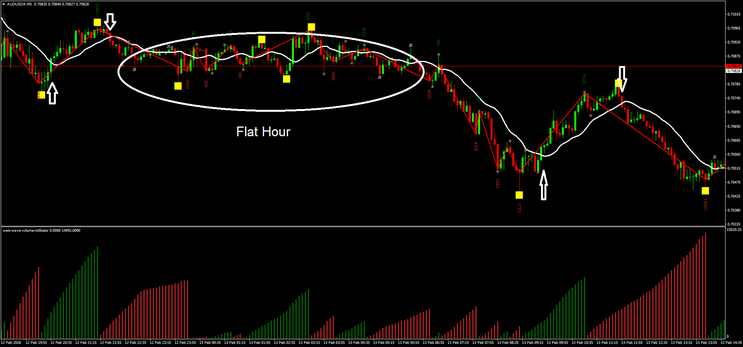
Important Notes
Do not trade:
if price is inside tight consolidation
if waves are expanding strongly in the entry direction
if the fractal appears but momentum is accelerating
Best conditions come after clear pushes followed by loss of strength.
Why This Works Better Than MA Alone
The moving average gives direction, but not timing.
Fractals provide timing.
Weis Wave tells you whether the reaction has real chances.
Remove one of these and accuracy usually drops.
Conclusions
This strategy is built to bring structure and discipline to short-term binary trading.
You follow:
trend → reaction → volume confirmation.
It will not eliminate losses, but it helps avoid entering while the market is still dominated by aggressive pressure.
Consistency comes from filtering bad trades, not from trading more.

Note for Forex CFD
Advanced Entry Models Professionals Use with Weis Wave
Professional traders use the Weis Wave to evaluate the relationship between price progress
and trading effort.
Their entries are built around moments when the market is no longer able to produce the same result with the same or greater volume.
They are essentially trading inefficiency.
1) The Failed Push (Volume Divergence)
This is one of the most powerful setups.
Price makes a new high (or low), but the wave volume is smaller than the previous impulse.
What it means:
the side in control is running out of participants.
Typical execution:
-
wait for the new high/low
-
confirm reduced volume
-
enter on the first sign of rejection or minor break of structure
The best reversals often start this way.
2) The Effort vs Result Mismatch
Here the market prints a large wave volume but achieves little price progress.
Interpretation:
strong opposition is absorbing orders.
This frequently appears near accumulation or distribution zones.
Entry technique:
-
identify heavy effort
-
observe poor follow-through
-
trade in the opposite direction once structure shifts
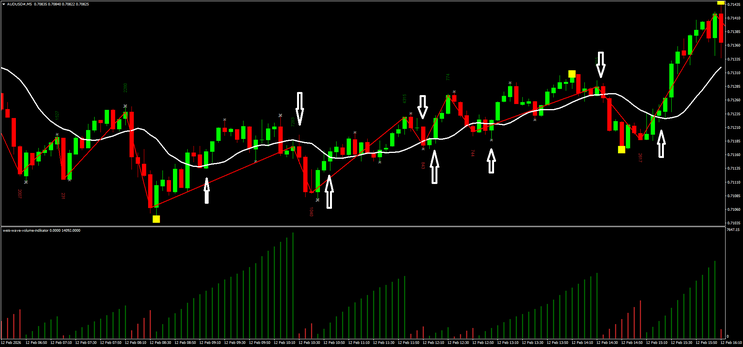
3) Pullback Compression Entry
In a healthy trend, retracements should show contracting waves.
Professionals love when:
-
the counter-trend move becomes smaller
-
volume decreases
-
volatility tightens
It signals lack of interest from the opposing side.
Entry is taken when the main trend resumes, often on a break of the pullback high/low.
4) Wave Expansion Breakout
Not all trades are reversals.
If a new impulse suddenly produces expanding volume compared to previous waves, professionals may enter in the direction of the breakout.
Why?
Because participation is increasing and trapped traders may fuel continuation.
5) The Two-Wave Test
A classic institutional logic.
If the market attempts twice and the second attempt has less volume, probability of failure increases sharply.
This model is frequently used to catch major turning points.
32# Binary Options Strategy: RSI 3 TF alert
RSI 3 TF alert binary Options Strategy high/low
Submit by Buddy 20/12/2103
RSI 3 TF Alert is a binary options trading strategy high/low trend following.
Currency pairs: EUR/USD, GBP/USD, AUD/USD and USD/CHF.
Rules of Binary Options Trading Strategy: RSI 3 TF alert
1) Trade only when the RSS 3 TF_Alert_22 Produces signals
2) The most important indicator is the red line with yellow bells on the RSS indicator. If the RSS indicator produces an alert arrow, look if the red line is below or above the mid range dotted line. If it is an up signal, look if the red line is up and trade if it’s up. Same goes if it’s down.
This is an example of a good and bad signal. The first one is ok. The red line is clearly above the mid range white dotted line. The second one shows the uptrend is exhausted and you might lose if you enter (or if you want to enter a trade, make sure at least the DSS is in line with your trade). Do not forget this rule.
5) When the BDftender is yellow, do not trade. It shows the market is moving sideways or too spiky. If you want to trade make sure at least that the other 3 indicators align.
6) The Tarzan indicator shows the long term trend direction. The Tarzan and the BDFtender determine the time range that I’ll trade. If it is the beginning of a new trend in the Tarzan indicator (after at least 3 candles for confirmation) I trade long. (1 hour)
- If it’s a new trend in the Bdftender up or down with confirmation of the DSS indicator, I’ll trade 30 min.
This is a 30min trade. I entered after the bearish candle closed. I’ve indicated the bearish candle with a white Arrow. Note that I use the 5MTF. It’s more stable compared to 1MTF and less compact compared to the 15MTF
If the arrow is not in accord with the DSS (8, 13) do not trade, wait for the signals to be aligned or wait for the next candle to confirm the direction.
Trust me; you don’t want to trade if those two are at opposites. DSS showing an uptrend and The RSS showing a down trend. The DSS will always win* (I’ve learnt this the hard way) Wait till the signals align. (Or enter very short trades).
-I trade 15min or less when the DSS is falling down. And it must be aligned with at least the RSS 3TF indicator.
When trading, you should always take into consideration the intensity of the BDF tender. Watching and practicing will make you understand more on how to inter-relate these indicators.
You should test this strategy before using it on your real accounts. Please note that the *RSS 3TF does not produce audible alerts or signals…so just check your charts after every 5mins when the candles are closing. Back test and improve this strategy. Any new ideas please share.
